Operations | Monitoring | ITSM | DevOps | Cloud

Building Dashboard and Dashboard Inputs in Cribl Search

This blog demonstrates how to create “inputs” to Cribl Search dashboards. An Input is a control widget that we can add to our Dashboards to control how they execute. They allow the user to supply a range of inputs to customize one or many of the Searches in each of the panels on a given dashboard. Currently, there are four types of inputs: a time picker, a dropdown, a string, and a number. This blog shows how to create all four types of Inputs on a dashboard using built-in sample data.
PX5 Announces Tracealyzer Support for PX5 RTOS

A little more than a month ago, we released the free Tracealyzer SDK – a toolkit that allows other embedded software vendors to integrate Tracealyzer recording in their own software. At that time, the development team at PX5 in California were already hard at work combining Tracealyzer with their PX5 RTOS, and yesterday they released the integration. Built with Percepio’s SDK, in a just a few weeks.

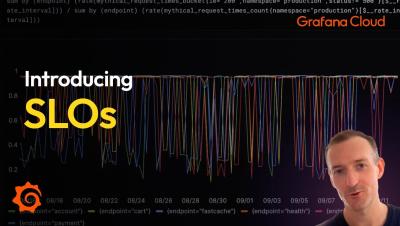
What is SLA? How to Handle SLA Breaches?

Service Level Agreements (SLAs) are foundational contracts that define the expectations and commitments between service providers and their customers. These agreements outline the quality, performance, and availability of services, setting the stage for a harmonious relationship. However, as service environments grow increasingly complex, the risk of SLA breaches looms ever larger.

Why Implementing App Security Can Lead To Spiraling Costs

Robust app security is non-negotiable, but the spiraling costs that can come with it are. In the context of application delivery, security plays a pivotal role in maintaining business continuity, protecting sensitive data, and upholding a solid reputation. However, the journey to build a formidable defense at the load balancing and reverse proxy layer can quickly become costly with a few wrong turns. Security is important, but buyers don’t have to break the bank to implement it.

LM Co-Pilot: Your AI Co-Pilot for the Magical Streamlining of IT and Cloud Operations

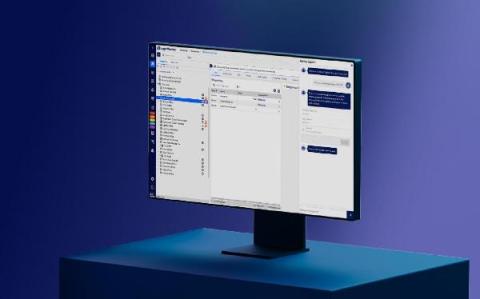
LogicMonitor’s Generative Intelligence Solution for IT Teams Cutting-edge generative technologies have revolutionized our industry, paving the way for fresh and innovative approaches to deliver interactive and actionable experiences. At LogicMonitor, we firmly believe in leveraging these generative techniques across our platform, offering a uniquely dynamic support system for various aspects of our end-user experience.

Resolve issues faster with Grafana Cloud Application Observability

Grafana Cloud Application Observability provides an out-of-the box experience to monitor application performance and minimize MTTR. With its native support of the open standards OpenTelemetry and Prometheus, Application Observability unifies signals across the full stack, accelerating root cause analysis while removing proprietary formats and vendor lock-in. Watch this demo of how to use Application Observability in Grafana Cloud.

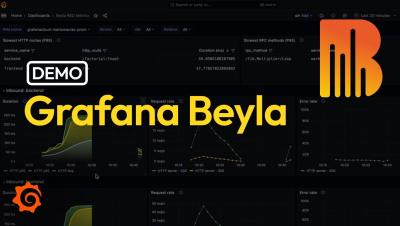
Zero-code application observability with Grafana Beyla and eBPF: demo

The eBPF-based OSS auto-instrumentation tool Grafana Beyla makes it easier to get started with application observability. Beyla provides RED (Rate, Errors, Duration) metrics through OpenTelemetry or Prometheus for your existing web services, whichever language they are written in. You don’t need to change any line of application code or configuration; you only need to deploy the Beyla in the same host as the service that you want to monitor. Collecting monitoring data with the eBPF autoinstrument tool has very low overhead, and allows you to capture data about your runtime, which is impossible with manual code instrumentation. Watch this in-depth demo of how to use Grafana Beyla to get started with application observability.