Operations | Monitoring | ITSM | DevOps | Cloud
Founder & Friends: How to get the most out of Raygun (Live Demo)
The top 12 APM tools for 2022
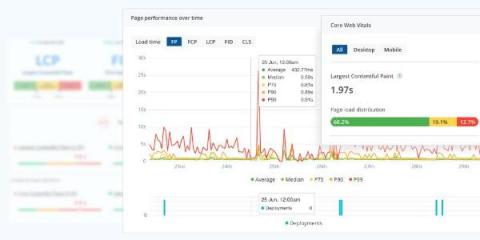
How Core Web Vitals create business impact
What are Core Web Vitals, and why should you care? Let's power through the essentials of CWV, CX and their impact on $$$. This is written with the busy software executive in mind - so we're sticking to a clear, big-picture view of metrics, user experience and revenue. Chances are, if you've heard about Core Web Vitals (CWV), it's been in the form of a stick: something Google is enforcing that can hurt your search engine visibility. We're here to go over the carrot - a quick explainer of Core Web Vitals, and how they can help you connect with customers and drive lasting innovation.
Core Web Vitals for Dev Leads
How much could software errors be costing your company?
Errors are an inevitable part of building software. But while you can't eradicate them, you can definitely mitigate them. If you don't measure, track or resolve errors, you're ignoring a loss in revenue. It's time to pay attention to how much software errors are costing your company and take action, catching them early with methods like smarter testing and crash reporting. Using a few industry averages, you can put a number to the real cost of software errors in your company and start to plug cash leaks like wasted developer time and lost customers.
The SDLC: phases, popular models, benefits & more
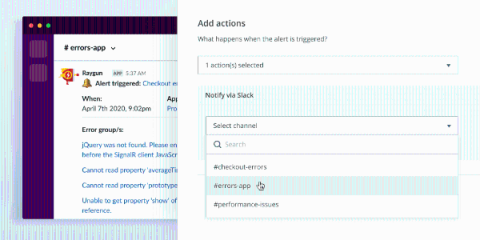
Coming soon! A sneak peek at Raygun Alerting's Slack integration
New and improved Python error grouping
How to implement a Blameless Postmortem (part two)
This is Part 2 of a two-part series on Blameless Postmortems. The previous article went into why blameless postmortems are so effective; this second part goes into detail on how to build your own postmortem process and kick it into overdrive. Read Part 1 here. So you've read our first installment and recognized the value of the blameless postmortem for efficiency, culture, and output. Now you're ready to get off the blame train and kickstart a blameless postmortem process of your own. Where to begin?


