Operations | Monitoring | ITSM | DevOps | Cloud
Founder & Friends - Introducing our Public API
Increase customer retention & stop leaving money in the shopping cart
We all know the pain and frustration associated with broken software. It's no secret that the internet is rife with broken links, slow pages, and broken shopping carts, often feeling like it's being held together with glue and duct tape. These issues aren't just causing frustration for customers; it costs businesses millions. According to the Consortium for Information and Software Quality, poor software quality cost US companies $2.08 trillion in 2020. Every interaction between a customer and your technology is an opportunity to build or destroy trust. People tend to have a poor memory when things go right, but oh boy, do they remember when something broke.
Java vs Python: Code examples and comparison
As two of the most popular and practical languages out there, should you choose Java or Python for your next project? Is one of these languages a clear-cut better option? The answer is a long one. According to GitHub’s annual Octoverse report, Python has now climbed to the second most popular language in usage, pushing Java down to third place.
Crash Reporting & Real User Monitoring for React applications
Announcement: Raygun Launches Public API
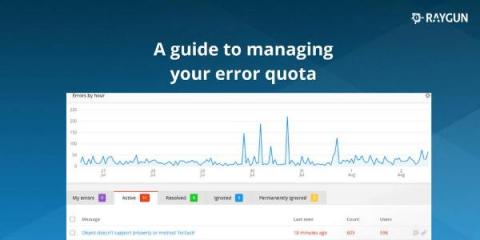
Manage your Raygun quota effectively with these tips
Raygun 15-minute walkthrough
17 Popular Java Frameworks for 2023: Pros, cons, and more
12 top PHP frameworks for web developers to consider in 2023
PHP, or Hypertext Preprocessor (originally Personal Home Page), is an open-source server-side scripting language used for developing dynamic websites and web applications. It’s extremely popular, too — more than 75% of all websites were still using PHP as of October 2022, with no signs of slowing down any time soon. It’s free to download and use and powerful enough to run some of the biggest websites on the internet (WordPress, Facebook, and Wikipedia, just to name a few).


