Operations | Monitoring | ITSM | DevOps | Cloud

netdata

All-new Netdata Cloud Charts 2.0

Netdata excels in collecting, storing, and organizing metrics in out-of-the-box dashboards for powerful troubleshooting. We are now doubling down on this by transforming data into even more effective visualizations, helping you make the most sense out of all your metrics for increased observability. The new Netdata Charts provide a ton of useful information and we invite you to further explore our new charts from a design and development perspective.

Install Netdata to get started monitoring Linux in minutes

Install Netdata to monitor your Linux servers using our one-line installer. Install on physical, virtual, container, and IoT nodes. Netdata’s free, open-source monitoring agent works with Netdata Cloud to help you monitor and troubleshoot every layer of your systems to find weaknesses before they turn into outages.

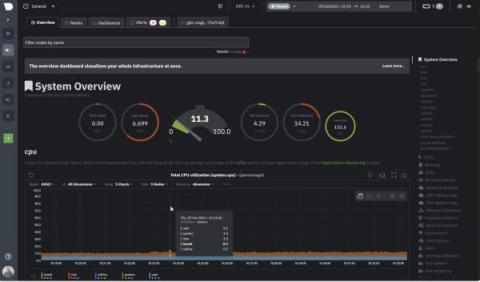
How to monitor Docker containers using Netdata health and performance

Learn how to connect and claim a Docker node to start monitoring with Netdata in minutes. See information like system CPU, available memory, disk usage, total network bandwidth, and much more. Netdata’s free, open-source monitoring agent works with Netdata Cloud to help you monitor and troubleshoot every layer of your systems to find weaknesses before they turn into outages.

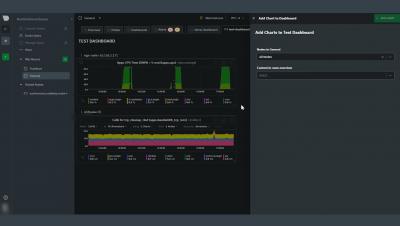
Learn how to build interactive dashboards with Netdata Cloud for troubleshooting systems

This video will show you how to build new dashboards with key metrics from any number of distributed systems in one place for a bird's eye view of your infrastructure. Create more meaningful visualizations for troubleshooting or keep a watchful eye on your infrastructure's most meaningful metrics without moving from node to node. Netdata’s free, open-source monitoring agent works with Netdata Cloud to help you monitor and troubleshoot every layer of your systems to find weaknesses before they turn into outages.

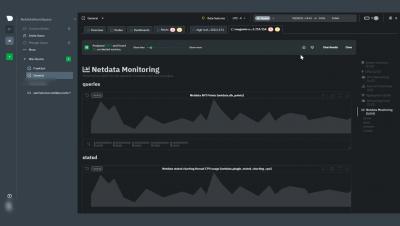
How to use Netdata Cloud for infrastructure observability

In this video, we cover how Netdata Cloud provides scalable infrastructure monitoring for any number of distributed nodes running the Netdata Agent. Monitor any system in your infrastructure including physical or virtual machines (VM), containers, cloud deployments, or edge / IoT devices. Netdata’s free, open-source monitoring agent works with Netdata Cloud to help you monitor and troubleshoot every layer of your systems to find weaknesses before they turn into outages.

Using Netdata's alerts smartboard for monitoring systems' health and performance

The alerts smartboard gives you high-level information for every node you are monitoring with Netdata Cloud. In this video, you will learn how to navigate through the alerts smartboard as well as what each alert means. Netdata’s free, open-source monitoring agent works with Netdata Cloud to help you monitor and troubleshoot every layer of your systems to find weaknesses before they turn into outages.

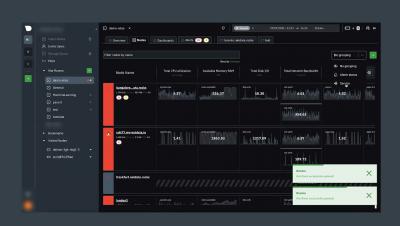
Netdata's Nodes view for troubleshooting system health and performance

This video introduces you to the Netdata Nodes view. Use this view to visualize and customize metrics from any number of Agent-monitored nodes and navigate to any specific nodes within the dashboard. View key monitoring metrics like CPU utilization, memory usage, disk usage, network traffic, and much more to get started troubleshooting performance issues or anomalies. Netdata’s free, open-source monitoring agent works with Netdata Cloud to help you monitor and troubleshoot every layer of your systems to find weaknesses before they turn into outages.

Intro to Netdata Overview for monitoring and troubleshooting your IT infrastructure

Learn how to get started monitoring and troubleshooting your entire Cloud infrastructure with Netdata. In this video, we'll show you how to utilize the Netdata Overview dashboard to gain visibility into the performance, availability, and health of your infrastructure from a single pane of glass. Navigate from a real-time, unified display of all your systems and applications to discover trends and gain better observability, then drill down by grouping metrics by node for root cause analysis.

How to extend the Geth collector

This is the the last of a 2-part blog post series regarding Netdata and Geth. If you missed the first, be sure to check it out here. Geth is short for Go-Ethereum and is the official implementation of the Ethereum Client in Go. Currently it’s one of the most widely used implementations and a core piece of infrastructure for the Ethereum ecosystem. With this proof of concept I wanted to showcase how easy it really is to gather data from any Prometheus endpoint and visualize them in Netdata.