Operations | Monitoring | ITSM | DevOps | Cloud

netdata

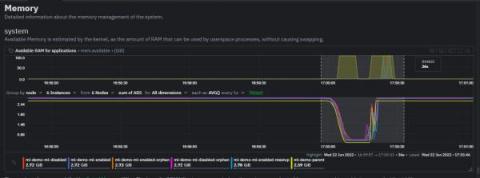
Root cause analysis using Metric Correlations

As complexity of systems and applications continue to evolve and change, the number of metrics that need to be monitored grows in parallel. Whether you’re on a DevOps team, an SRE, or a developer building the code yourself, many of these components may be fragmented across your infrastructure, making it increasingly difficult to identify the root cause when experiencing downtime or abnormal behavior.

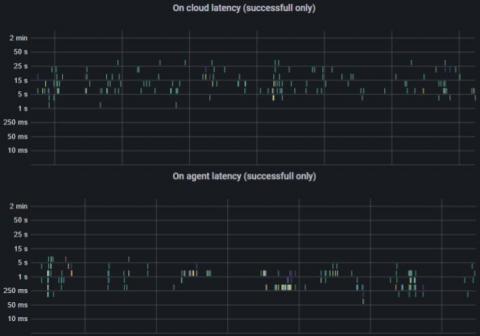
How to monitor your disks and filesystems, now also with eBPF

Current IT monitoring software lacks the necessary metrics for minimizing downtime for systems and applications. Most provide system and application metrics but there is much more than this required for properly monitoring your infrastructure. With eBPF there is a technological advancement that allows monitoring software to provide rich information from the Linux kernel and present it.

Netdata is launching its Discord server

It’s been a long time since our last community update, rest assured that we have been hard at work here at Netdata. Community building is hard, especially when you have such a venerable community like the one here at Netdata, where hundreds of contributors have contributed to creating one of the best monitoring solutions that exist. Last year we started to concentrate working on consolidating the community by integrating the various platforms where people come together to talk about Netdata.

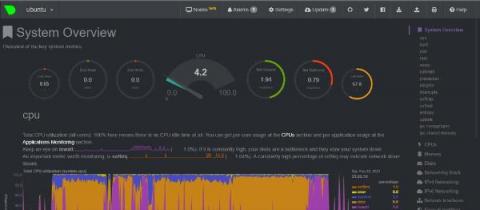
Kubernetes monitoring and troubleshooting made simple

Infrastructure monitoring was difficult enough when entire businesses ran off a few bare metal servers in a dusty, forgotten closet. Other IT infrastructure monitoring tools fell short, unable to provide complete and granular-enough metrics in real time, even when we were only dealing with a handful of systems responsible for running every part of the application stack.

Container deployment showdown: Docker or Kubernetes?

Monitoring the current state and performance of applications is critical for IT Ops and DevOps teams alike. Understanding the health of an application is one of the most effective ways of anticipating potential bottlenecks or slowdowns, yet it’s one of the largest challenges faced by many organizations that build and deploy software. This is largely due to applications’ distributed and diversified nature.

Start Kubernetes monitoring in 5 minutes with Netdata

While Kubernetes (k8s) might simplify the way you deploy, scale, and load-balance your applications, not all clusters come with "batteries included" when it comes to monitoring. Doubly so for a monitoring stack that helps you actively troubleshoot issues with your cluster. You need robust Kubernetes monitoring, but you don’t want to spend a week setting it up, much less a single valuable day.

5 DevOps best practices to reinforce with monitoring tools

As part of a modern software development team, you’re asked to do a lot. You’re supposed to build faster, release more frequently, crush bugs, and integrate testing suites along the way. You’re supposed to implement and practice a strong DevOps culture, read entire novels about SRE best practices, go agile, or add a bunch of Scrum ceremonies to everyone’s calendar.

Introduction to StatsD

StatsD is an industry-standard technology stack for monitoring applications and instrumenting any piece of software to deliver custom metrics. The StatsD architecture is based on delivering the metrics via UDP packets from any application to a central statsD server. Although the original StatsD server was written in Node.js, there are many implementations today, with Netdata being one of them.