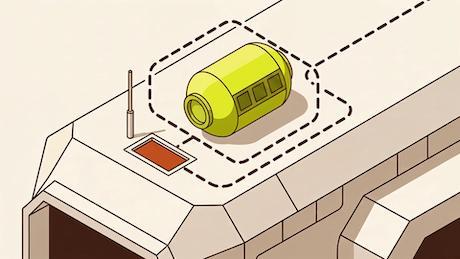
Isolation keeps an agent’s code away from your infrastructure. A smart sandbox also lets the agent into the systems where real bugs live, without handing it the keys.
If you're using agents and MCPs to get a better understanding of your environment or work through an investigation, you can get a lot of useful information back. You can pull logs, look at recent changes, and check how services are configured, but you're still the one deciding what to do with all of it. That part of the process still lives in your head. To see where Jev might fit, look at decisions your team already makes and work backwards from them.
To monitor a database backup, make the backup script check its own output (exit code, file size, a table you know must be there) and ping a heartbeat URL only when all of it passed. If that ping does not arrive on schedule, you get an alert. A backup that failed, wrote an empty file, hung, or never started all look the same from the outside: no success ping.
To monitor Celery beat, give each periodic task its own heartbeat URL and ping it from the worker when the task succeeds, with a task_success signal handler. If beat is down, the message sits in a queue no worker reads, or the task raises, the ping does not arrive and you get an alert. The trap is that beat only publishes messages: its log prints Sending due task on schedule whether or not anything ever runs the task.
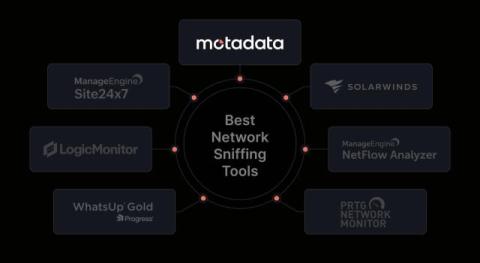
Ever wondered what is actually using your network when it suddenly slows down? It could be a device sending too much data, a backup running at the wrong time, or an application taking too long to respond. Without visibility into network traffic, finding the real cause can take hours. That’s where network sniffing tools can help. They let you inspect network traffic, capture packets, and see what is happening between devices, servers, and applications.
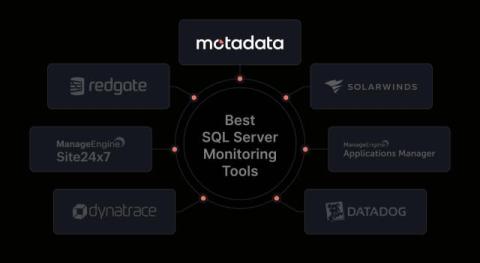
A slow query can affect an application before the database team knows what is causing it. A blocked session, failed job, or growing database file can create more problems if no one spots it early. That’s where SQL Server monitoring tools come in. They help you track database performance, find slow queries, monitor waits and locks, and see what changed before a problem occurred.
Your agent has earned trust in shadow mode. Now it runs on its own: an alert fires, the agent starts, investigates and proposes a fix before anyone opens a laptop. Here is what it takes to make that safe, scalable and better every week. This is the third article in a series on taking an AI SRE agent from a weekend experiment to production. Part 1 built a local, read-only agent on a throwaway cluster and refined it against a synthetic eval set.
We built an AI agent on Qovery to investigate Sentry alerts before our team picks them up. Here’s how the workflow runs, what it delivers, and where engineers still need to step in. Rémi is a staff frontend engineer at Qovery. He writes about frontend architecture, developer experience, and building scalable UI systems for platform engineering tools.
If you’ve built your telemetry pipelines around OpenTelemetry Collectors, you’ve already invested in a collector distribution, YAML configuration, and a deployment model that fits your infrastructure. As that deployment grows, managing it means keeping shared configuration consistent, accommodating different workloads, and understanding whether your collectors are healthy. Fleet Management in Grafana Cloud brings those tasks together in one place.
Connect GitHub, let Harness generate your CI pipeline, then build and push a Docker image to DockerHub. No YAML required. Creating your first CI pipeline usually sounds simple until you actually start. You connect your repository, figure out what stages you need, configure the build steps, set up the runtime, add caching, testing, credentials, and then hope the first run actually works.