Operations | Monitoring | ITSM | DevOps | Cloud

Grafana

Instrumenting a .NET web API using OpenTelemetry, Tempo, and Grafana Cloud

OpenTelemetry is a CNCF project that standardizes observability (logs, metrics, and traces) across many languages and tools. Today we will look at how we can use the OpenTelemetry .NET library to instrument a .NET 5.0 web API, to offload traces to Tempo and logs to Loki in Grafana Cloud. Grafana Cloud now has a free plan. Set up your account and follow along!

How the new time series panel brings major performance improvements and new visualization features to Grafana 7.4

In Grafana 7.0, we introduced a new panel architecture to enhance the UX and visualization options and create a more consistent experience across Grafana. In Grafana 7.4, we expanded on that foundation and introduced the next-generation graph panel called Time series panel, which is currently in beta. The Time series panel uses the panel architecture of Grafana 7.0 and integrates with field options, overrides, and transformations.

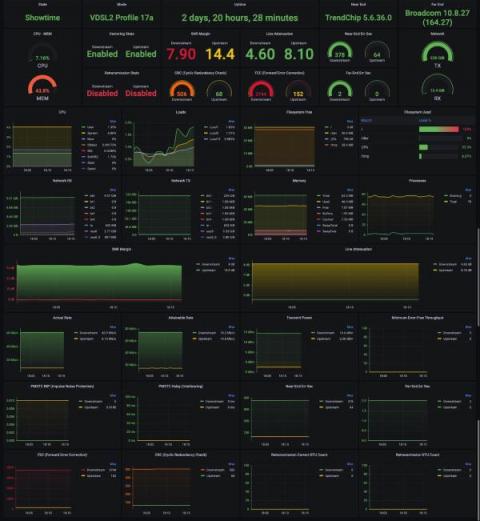
How I monitor my OpenWrt router with Grafana Cloud and Prometheus

I’ve been an open source fan and user for many, many years, going back to before we defined the term “open source” and we called it “free software.” Whenever and wherever possible I prefer to have control over the software I run on my devices. Case in point: My internet router runs OpenWrt, which is a free/open source Linux operating system designed to replace the software provided by the router’s manufacturer.

The Splunk plugin for Grafana now supports data links for jumping directly from logs to traces

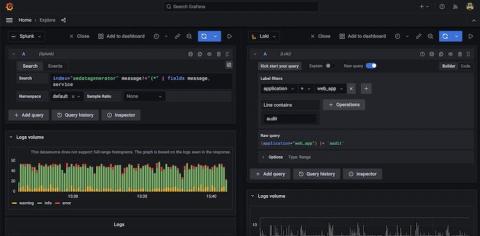
Hey there! This is Éamon Ryan from the Solutions Engineering team. Very recently the Splunk data source plugin, which is available with a Grafana Enterprise license, had a new release: v2.1.0. While it added a few good bug fixes for edge cases, the biggest change, I think, was the addition of support for data links! Data links actually show up in a few places inside Grafana.

Grafana 7.4 released: Next-generation graph panel with 30 fps live streaming, Prometheus exemplar support, trace to logs, and more

Grafana v7.4 has been released! The big news for Grafana 7.4 is the next-generation graph panel called time series, which is in beta. A high-performance visualization based on the uPlot library, it uses the new panel architecture introduced in Grafana 7.0 and integrates with field options, overrides, and transformations.

Auto-instrumenting a Java Spring Boot application for traces and logs using OpenTelemetry and Grafana Tempo

Auto-instrumentation is a subject I have not had much experience with. Here at Grafana Labs, we primarily develop in Go, which doesn’t afford such luxuries. However, there is an enormous amount of interest from the community in Java auto-instrumentation, so I set out to determine what was possible using the shiny new OpenTelemetry auto-instrumentation libraries.

Real-time monitoring of Formula 1 telemetry data on Kubernetes with Grafana, Apache Kafka, and Strimzi

Data streaming is important for getting insights in real time and reacting to events as fast as possible. Its application is wide, from banking transactions and website click analytics to IoT devices and motorsports. The last example represents a really interesting use case.

Farewell, worldPing. Hello, Grafana Cloud synthetic monitoring!

Many of us get sentimental about past projects we’ve worked on…for me it is a mobile dashboard that leveraged ML/AI to help a sales team make quicker decisions while in the field (nerdy, I know…but it was one of my first projects as a UX Designer when I was starting out my career, and I have many fond memories about this project). For many members of the team at Grafana Labs, that sentimental project is worldPing.

How we live-migrated massive Cortex clusters to blocks storage with zero impact to Grafana Cloud customers

January 20, 15:01 UTC. I was sitting in my home office, watching the screen and feeling a mix of emotion and nostalgia as a pod was getting terminated. We have thousands of pods, continuously starting and terminating, and I’m definitely not spending my days watching them, so why was this one special? The terminating ingester-0 pod was the very last Cortex ingester running on chunks storage in Grafana Labs’ infrastructure.