We are beyond thrilled to announce the arrival of Grafana 10, which was highlighted during the GrafanaCON 2023 keynote. The latest major release of the popular visualization and monitoring tool, which now has more than 20 million users around the world, is not just about introducing new features. Grafana 10 is also about enabling you to achieve more — more analysis, more collaboration, more insights, more efficiency and, of course, more beautiful dashboards. Grafana: download now!
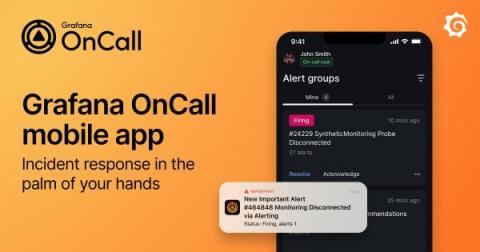
We’ve all been there: Sleeping peacefully in bed over the weekend, finally getting rest after a long week at your computer making AI-generated memes writing code. Then at 3 a.m., your phone makes an ungodly sound, and you wake up startled, frazzled, and confused. When you finally type in your passcode to unlock your phone (because facial recognition doesn’t register your bleary-eyed, squinty face), you see an alert, and all dreams of sleep are over.
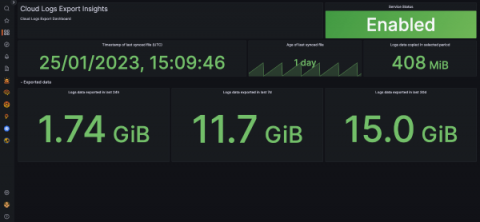
Late last year we announced an early access program for Grafana Cloud Logs Export, a feature that allows users to easily export logs from Grafana Cloud to their own cloud-based object storage for long-term archival purposes. We are pleased to announce that the feature is now in public preview for all Grafana Cloud users, including those on the Free tier!
Grafana Agent v0.34 is now available! The v0.34 release includes features for remote secrets, better Kubernetes integration, and above all, more community involvement. The Grafana Agent team is also excited to continue driving growth around Grafana Agent Flow, a configuration mode that makes Grafana Agent easier and more powerful to run.
18 million — that’s the number of developers around the world who use Docker, the popular tool for containerization. Docker Desktop, a software application for Mac, Windows, and Linux, is one of the most widely used tools within the Docker ecosystem, especially among developers who want to build, test, and deploy applications in containers on their local machines.
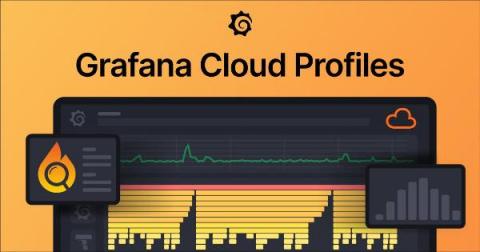
When we announced that Pyroscope was joining Grafana Labs back in March, we expressed our excitement that uniting the Pyroscope and Phlare open source projects and teams would accelerate our plan to add continuous profiling to Grafana Cloud. Just two and a half months later, that day has come! We are proud to announce that Grafana Cloud Profiles is now available in public preview for all Grafana Cloud users, both paid and free.
Grafana Incident, Grafana’s powerful incident response tool, comes with a range of integrations out of the box, including Zoom and Google Meet spaces, GitHub and JIRA issues, and even a Google Doc template for post-incident review documents. However, every team has unique needs and workflows, and you may need to integrate with other systems not currently on our roadmap or even use your own in-house tools.
The Grafana k6 browser module simulates how users interact with a browser page and collects web performance metrics about the interaction. Since launching the module in 2021, we’re frequently asked how it compares to Google Lighthouse as a tool to measure web page performance. This blog post compares k6 browser and Google Lighthouse from various perspectives, including: Note: k6 browser is a part of Grafana k6 OSS.