Operations | Monitoring | ITSM | DevOps | Cloud
Tales of A11y In Grafana OS: Introducing Pa11y CI into our pipeline by Alexa Vargas
Using Thanos to gain a unified way to query over multiple clusters by Wiard van Rij
Grafana 8.2 released: Dynamic plugin catalog, new fine-grained access control permissions, and more
Grafana 8.2 is here! This release marks the start of our work focused on measurable improvements to Grafana’s accessibility — part of our continuing mission to democratize metrics for everyone. The initial changes to Grafana in 8.2 are focused on navigation, with more to come. We’ll be sharing more about our accessibility roadmap in an upcoming blog post.
How Lightbend uses Grafana Cloud to monitor a platform-as-a-service launch
When top companies have needed platforms for their demanding, globally distributed, cloud native application environments and streaming data pipelines, they’ve turned to Akka, the most popular implementation of the Actor Model for cloud native applications running on Kubernetes. The company behind Akka is Lightbend, a leader in the world of cloud native applications and architectures.
The U.S. Department of Defense formally authorizes Grafana, Grafana Enterprise, and Loki for its 100,000 developers
Not so long ago, development teams working for the U.S. Department of Defense could take anywhere from three to ten years to deliver software. “It was mostly teams using waterfall, no minimum viable product, no incremental delivery, and no feedback loop from end users,” Nicolas M. Chaillan, Chief Software Officer of the U.S. Air Force, said in a CNCF case study. “Particularly when it comes to AI, machine learning, and cybersecurity, everyone realized we have to move faster.”
With the Salesforce plugin for Grafana, easily visualize your SFDC data and correlate it with other data sources
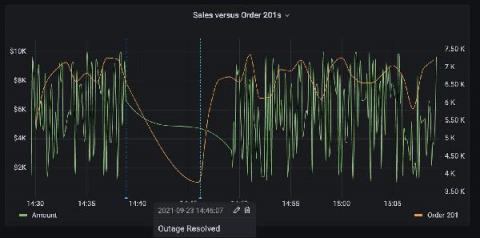
Good news for Salesforce users: With the new Salesforce plugin for Grafana, available now with an Enterprise license, you can instantly visualize your SFDC data in Grafana dashboards. Plus, Grafana allows you to visualize the Salesforce data alongside all sorts of other data. One interesting use case is correlating sales data to system metrics and logs, which would be valuable if your company uses any software systems at all to help generate revenue.
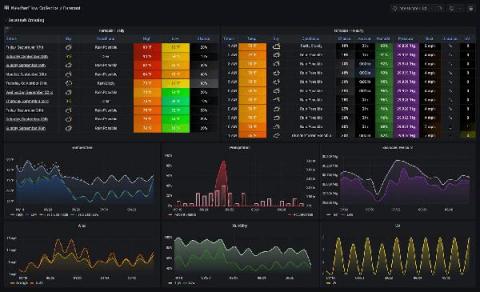
How to visualize real-time data from an IoT smart home weather station with Grafana dashboards
One of the experiences I’ve truly enjoyed over my first year as a senior solutions engineer here at Grafana Labs has been learning from our community and customers about their own Grafana journeys. I’ve been impressed by some remarkable dashboards for home automation, personal health data visualizations, family Minecraft statistics, and energy usage projects.
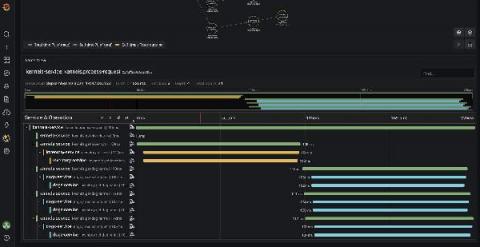
Intro to distributed tracing with Tempo, OpenTelemetry, and Grafana Cloud
I’ve spent most of my career working with tech in various forms, and for the last ten years or so, I’ve focused a lot on building, maintaining, and operating robust, reliable systems. This has led me to put a lot of time into researching, evaluating, and implementing different solutions for automatic failure detection, monitoring, and more recently, observability. Before we get started: What is observability?
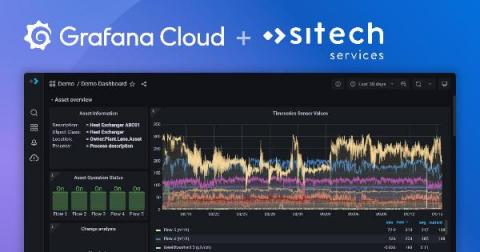
How Sitech builds modern industrial IoT monitoring solutions on Grafana Cloud
Chemelot is an industrial park in the Netherlands with more than 150 companies in chemical and process industries that are working to build the most sustainable and competitive chemical site in Western Europe. Sitech Services is part of making that happen. The Dutch technology firm brings together maintenance and engineering specialists with data scientists to create multidisciplinary solutions that achieve optimal safety, efficient infrastructure, and efficient processes for the plants.


