Operations | Monitoring | ITSM | DevOps | Cloud
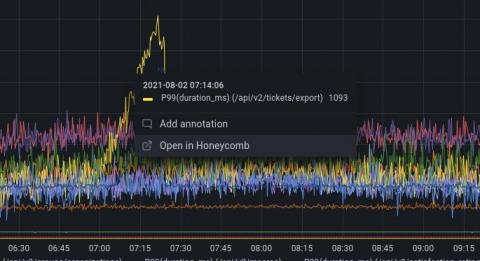
Introducing the Honeycomb plugin for Grafana
Over the years, we’ve heard many versions of the same familiar story: large businesses struggling with observability data living in several different systems. At Grafana Labs, our “big tent” philosophy is based on the belief that our users should determine their own observability strategy and choose their own tools. Grafana allows them to bring together and understand all their data, no matter where it lives.
Grafana Tempo 1.1 released: New hedged requests reduce latency by 45%
Grafana Tempo 1.1 has been released, and like our major version suggests, there are no breaking changes. If you’d like, please check out the release notes . But if you find that release notes can sometimes be difficult to decode, fret not! All the highlights are below.
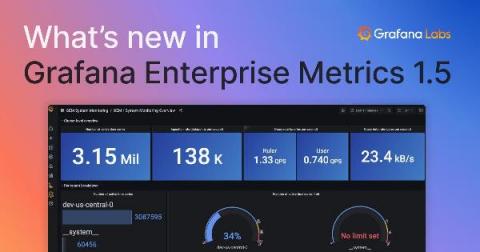
What's new in Grafana Enterprise Metrics 1.5: Per-tenant usage metrics and a wildcard tenant for queries
We’re thrilled to announce the release of Grafana Enterprise Metrics (GEM) 1.5. While this release packs in a ton of enhancements and bug fixes, we’d like to dive into two particularly exciting features: per-tenant usage metrics and a wildcard tenant for queries.
How we're supporting the success of our community and customers with our recent funding rounds
This morning, we announced that Grafana Labs has raised $220 million in Series C funding . As with our previous rounds in 2019 and 2020 , this funding will enable us to focus on accelerating the development of our open source observability platform and supporting the success of our community and our customers.
How we use the k6 load-testing tool for developing Grafana
On the last day of GrafanaCONline in June, our CEO Raj Dutt announced that Grafana Labs had acquired k6 , the company behind the open source load-testing tool. In fact, our relationship with k6 had started more than two years earlier. At the beginning of 2019, we were working on replacing Grafana’s “remember me” cookie solution with a short-lived token solution for the Grafana 6.0 release.
How an observability consulting company solved a client's monitoring issues with Grafana Cloud
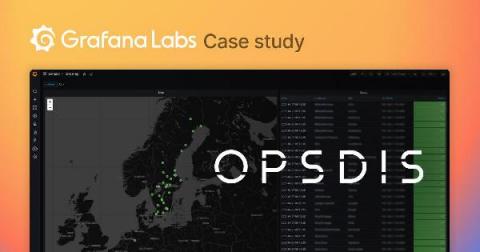
Companies are always looking for transparency and visibility when it comes to monitoring, but as monitoring requirements and methods evolve, it’s not always easy to keep up. That’s why Opsdis, an observability consulting company based in Göteborg, Sweden, was founded. The firm focuses solely on helping clients implement systems for monitoring and metrics so they can keep up with the ever-expanding world of cloud computing and containerized environments.
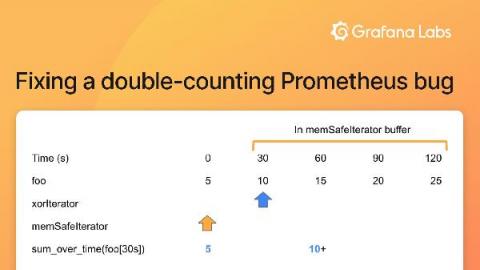
How we fixed a double-counting Prometheus bug while working on a Grafana Cloud project
In my role as a software engineer at Grafana Labs, I recently worked on a project that involved generating PromQL queries. One of the ways we verified the correctness of the generated queries was with a suite of integration tests. These tests would execute the generated PromQL queries against a local instance of the Prometheus query engine with some test data, and verify the results were as expected.
Grafana meetup recap: SLO tips, Agrology's IoT monitoring setup, and wide time series format
Last week at Grafana Labs, we launched our new Grafana Meetup Program with our East Coast Virtual Meetup. It was a ton of fun bringing together the community for this first event in our meetup series, but the road to getting here has been quite a journey! As a community-driven company, going more than a year without any in-person events has been pretty rough on all of us Grafanistas.
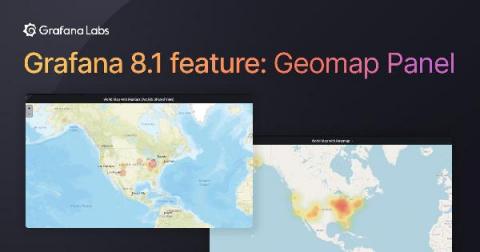
What's new in Grafana 8.1: Geomap panel
The Worldmap panel in Grafana is an existing feature in OSS that has been widely used, but it has some limits that weren’t easily fixed. Now with the release of Grafana v8.1 , we have introduced an upgrade to the Worldmap panel with the new Geomap panel visualization that allows you to view and customize a world map using geospatial data, all while sharing the same infrastructure with our core UI.


