Operations | Monitoring | ITSM | DevOps | Cloud

Grafana

How we fixed a double-counting Prometheus bug while working on a Grafana Cloud project

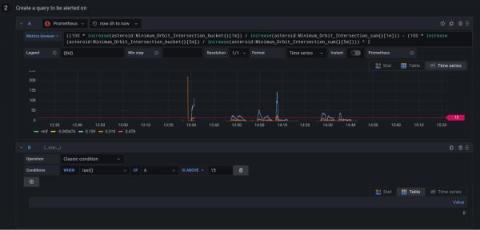
In my role as a software engineer at Grafana Labs, I recently worked on a project that involved generating PromQL queries. One of the ways we verified the correctness of the generated queries was with a suite of integration tests. These tests would execute the generated PromQL queries against a local instance of the Prometheus query engine with some test data, and verify the results were as expected.

Grafana meetup recap: SLO tips, Agrology's IoT monitoring setup, and wide time series format

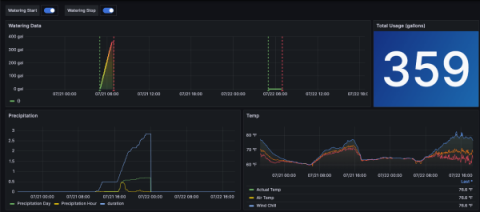
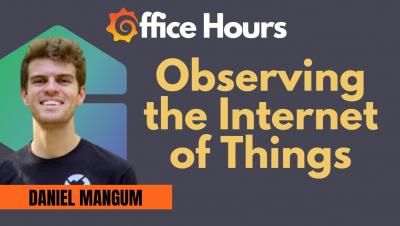
Last week at Grafana Labs, we launched our new Grafana Meetup Program with our East Coast Virtual Meetup. It was a ton of fun bringing together the community for this first event in our meetup series, but the road to getting here has been quite a journey! As a community-driven company, going more than a year without any in-person events has been pretty rough on all of us Grafanistas.

What's new in Grafana 8.1: Geomap panel

The Worldmap panel in Grafana is an existing feature in OSS that has been widely used, but it has some limits that weren’t easily fixed. Now with the release of Grafana v8.1 , we have introduced an upgrade to the Worldmap panel with the new Geomap panel visualization that allows you to view and customize a world map using geospatial data, all while sharing the same infrastructure with our core UI.

Streaming real-time sensor data to Grafana using MQTT and Grafana Live

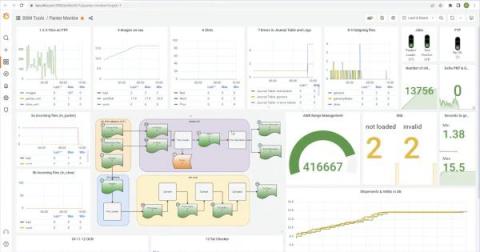
Within the world of robotics and automation one of the most recurring needs is that of capturing and visualizing real-time data from hardware components such as sensors and actuators, which provide insights into how a system is behaving overall and helps diagnose any potential issues that might arise overtime.

WTF! Migrating to Grafana's wide time series format presented by Stephanie Closson

The wide time series format was introduced in Grafana 7.5, and has been the standard for time series data since. This new format does not work well with older panels though. WTF? Learn how to spot time series format issues, and solve them. Presented by Stephanie Closson, Software Engineer at Grafana Labs at Grafana East Coast Virtual Meetup - August 2021

SLOs, SLIs, and where to find them with Jacob Plicque III

Identifying the right the right Service-Level Indicators is mission-critical for any SRE team responsible for meeting Service-Level Objectives and reporting on them. Find out how to sift through mountains of metrics and fill gaps in your data in order to visualize SLIs that actually matter for effective error budget tracking and actionable alerts in Grafana. Presented by: Jacob Plicque III, Senior Engineer at Grafana Labs at Grafana East Coast Virtual Meetup - August 2021

A guide to deploying Grafana Loki and Grafana Tempo without Kubernetes on AWS Fargate

At Seniorlink, we provide services and technology to support families caring for their loved ones at home. In the past two years we’ve expanded our programs across the United States, and so our need to observe our application systems has grown too.

Grafana Community Plugin Showcase: August 2021

The power of community makes Grafana one of the most composable platforms for monitoring and observability across a wide variety of use cases. The Grafana Plugin Directory features not just plugins created by our team here at Grafana Labs, but by Grafana community members all over the world. It’s the best place to browse for new data source integrations, panels, and applications you can install on your dashboard to extend Grafana’s functionality.

New in Loki 2.3: LogQL pattern parser makes it easier to extract data from unstructured logs

Writing LogQL queries to access Loki’s log data just got easier, thanks to the new pattern parser released with Loki 2.3. It makes writing queries for unstructured log formats simple. And the pattern parser can be an order of magnitude faster than the regular expression parser. Let’s take a closer look.