Operations | Monitoring | ITSM | DevOps | Cloud

How to use flow mode for Grafana Agent with Matt Durham (Grafana Office Hours #21)

Senior Software Engineer Matt Durham shows us how to use flow mode for Grafana Agent. Flow mode is a new and better way to install and configure Grafana Agent than the older "static mode". Among other things, flow mode's modularity makes it easier to build more complex workflows like traditional data pipelines and allows for more use cases than collecting and processing telemetry.

New in Grafana roles: Manage user permissions better with 'No basic role'

Since we introduced role-based access control (RBAC) in Grafana 9.0, users — and later, service accounts — have been required to have an assigned role that includes a basic set of permissions. This sometimes led organizations to create users and service accounts that had more permissions than necessary. As a result, Grafana administrators had to make additional adjustments to users’ permissions on a case-by-case basis.

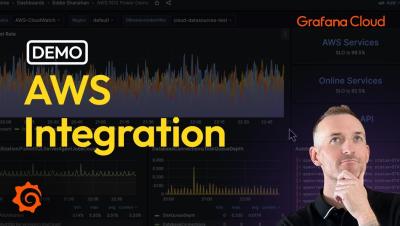
Effortlessly monitor AWS services in Grafana Cloud

Including AWS service metrics and logs into a single pane of glass helps engineers get holistic visibility into their infrastructure. Analyze 60+ AWS services across your individual accounts and regions without the toil of configuring data and building dashboards from scratch. Learn how to: Sign up for a free Grafana Cloud account today and unlock the potential of distributed tracing in your performance testing workflow.

Building scalable OSS observability with Mimir, Loki, Tempo, and Pyroscope | ObservabilityCON 2023

In this video, we cover the latest and greatest news about the scalability and performance of the open source telemetry backends that make up the Grafana LGTM Stack: Grafana Mimir for Prometheus metrics, Grafana Loki for logs, and Grafana Tempo for traces.

Do you need an OpenTelemetry Collector?

When you use OpenTelemetry SDKs to collect logs, metrics, and traces from infrastructure or an application, you’ll find many references to people using Grafana Agent and OpenTelemetry Collector. They start with an application or infrastructure that sends telemetry, and that data is sent to a collector, which then sends it to a backend like Grafana that may perform many functions, including visualization.

User-centered observability: load testing, real user monitoring & synthetics | ObservabilityCON 2023

Understanding your end users’ experience with your applications and services is critical, and there are a variety of tools to help. But there are also a number of different use cases: During development or in production? Simulate user behavior or monitor real user behavior? What should you use and when? This recorded session explores when and how to apply load testing, synthetic monitoring, and real user monitoring to gain insights into the end user experience of your critical applications.

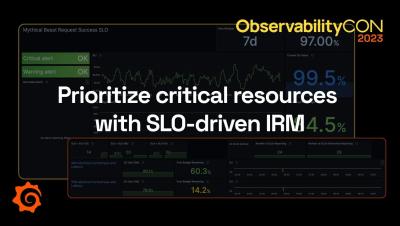
Grafana SLO Demo: Prioritize critical resources with SLO-driven IRM | ObservabilityCON 2023

A majority of respondents in our Observability Survey said they were using SLOs or moving in that direction. For good reason: By highlighting the most critical error budget burndown, service level objectives (SLOs) can help you prioritize performance issues based on business impact. In this recording, Josh Abreu Mesa and Reem Tariq walk through how Grafana Cloud’s integrated SLO and Incident Response Management (IRM) capabilities can help you identify the most important issues and resolve them quickly.

How Pipedrive switched its observability stack to OpenTelemetry & LGTM | ObservabilityCON 2023

The cloud-based CRM company Pipedrive has been relentlessly modernising its observability stack, first adopting Grafana visualisation and Grafana Mimir for Prometheus metrics, then recently completed a migration of its distributed tracing from a third-party SaaS provider to OpenTelemetry and Grafana Tempo, and its logging stack from Graylog to Grafana Loki. Along the way, the team developed its own in-house library to include OpenTelemetry in its roughly 750 microservices.

Manage metrics & logging costs with Grafana Cloud + Log Volume Explorer demo | ObservabilityCON

Are your SRE and platform teams under pressure to ingest fewer metrics and logs in the name of cost savings? Reducing costs does not have to mean reduced observability. This recording walks through the cost management features in Grafana Cloud that allow you to analyze, attribute, monitor, and optimize your metrics and logs usage – and lower costs – without compromising your observability strategy.