At Grafana Labs, we are continuing to build integrations that make it easier than ever to observe your systems, no matter which tools or software you choose. Today, we’re excited to talk about the latest integration available in Grafana Cloud: the AWS CloudWatch metrics integration, the first of our fully managed integrations that makes it simple to connect and visualize your data in Grafana.
On 2021-10-29, initial support for Prometheus Agent was merged, and it is slated for inclusion in Prometheus v2.32! This feature has a bit of a lengthy history to it: It took a little while to get to where we are today, but I’m thrilled that we were able to use the Grafana Agent code to enable agent-like functionality in the prometheus/prometheus repository.
Loki 2.4 is here! It comes with a very long list of cool new features, but there are a couple things I really want to focus on here. Be sure to check out the full release notes and of course the upgrade guide to get all the latest info about upgrading Loki. Also check out our ObservabilityCON 2021 session Why Loki is easier to use and operate than ever before.
Grafana Tempo 1.2 has been released! Among other things, we are proud to present both our first version to support search and the most performant version of Tempo ever released. There are also some minor breaking changes so make sure to check those out below. If you want ALL the details you can always check out the v1.2 changelog, but if that’s too much, this post will cover all the big ticket items.
Today, we are launching a new Grafana Labs product, Grafana Enterprise Traces. Powered by Grafana Tempo, our open source distributed tracing backend,.and built by the maintainers of the project, this offering is an exciting addition to our growing self-managed observability stack tailored for enterprises.
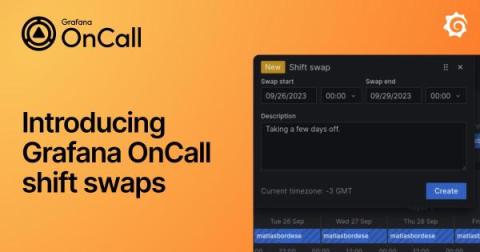
A critical part of managing modern software development is setting up and running an on-call rotation. But that often involves significant toil, in part because many of the existing tools are cumbersome and not developer-friendly. That’s why we’re excited to announce Grafana OnCall, an easy-to-use on-call management tool that will help reduce toil in on-call management through simpler workflows and interfaces tailored for devs.
This morning during the ObservabilityCON keynote, we announced some of the exciting projects and feature enhancements we’ve been working on for our customers and community. And it doesn’t end there. Throughout the week, we’ll continue to unveil new features, go deeper with live demos, and share our plans to shape the future of observability. With so many new announcements and features to check out, we want to make sure you know where to get more details about these developments.
As a composable solution, Grafana allows you to bring your data into dashboards natively without having to extract it, load it, or transform it. We believe in a “big tent” philosophy, which allows you to choose the tools that best suit your observability strategy, and with our plugins, Grafana is interoperable with more than 100 data sources.
Grafana Labs recently hosted its first company-wide hackathon, and we joined forces with Björn “Beorn” Rabenstein to bring sparse high-resolution histograms in Prometheus TSDB into a working prototype. The Prometheus TSDB has gained experimental support to store and retrieve these new sparse high-resolution histograms. At PromCon 2021, we presented our exciting, fresh-off-the-presses results from the ongoing project.