Operations | Monitoring | ITSM | DevOps | Cloud
How Grafana Labs switched to Karpenter to reduce costs and complexities in Amazon EKS
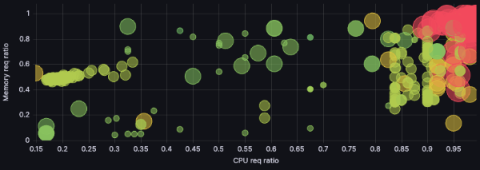
At Grafana Labs we meet our users where they are. We run our services in every major cloud provider, so they can have what they need, where they need it. But of course, different providers offer different services — and different challenges. When we first landed on AWS in 2022 and began using Amazon Elastic Kubernetes Service (Amazon EKS), we went with Cluster Autoscaler (CA) as our autoscaling tool of choice.
Resolve issues faster with Grafana Cloud Application Observability
Create and manage SLOs in Grafana Cloud
Zero-code application observability with Grafana Beyla and eBPF: demo
Control Prometheus cardinality and metrics cost with Adaptive Metrics
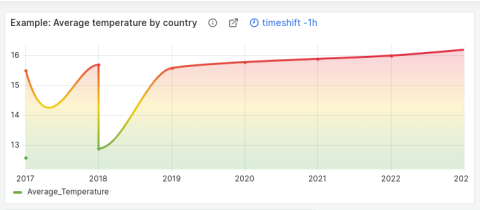
Grafana panel titles: Why we changed from center to left-aligned
As Grafana evolved over the years, so did our panel headers. In our quest for improvement, we continually added design options that created more comprehensive panels, but also an increasingly complex interface. It was a process of continual adaptation without a roadmap — which, though well-intentioned, began to result in unforeseen challenges.
Saga Design System: shaping the future of user experiences at Grafana Labs
At Grafana Labs, we want to empower our fellow Grafanistas and the community to get the most out of the Grafana LGTM Stack (Loki for logs, Grafana for visualization, Tempo for traces, and Mimir for metrics). As part of this effort, we recently launched a new Grafana developer portal. And now, we’re pleased to announce the launch of the Saga Design System, which establishes a shared visual language for all of Grafana Labs’ offerings.
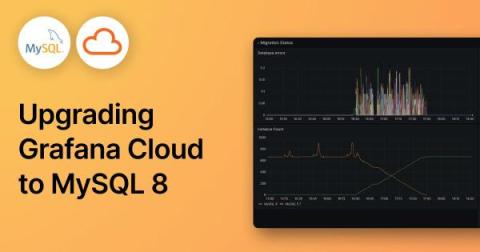
How we upgraded to MySQL 8 in Grafana Cloud
Starting around June this year, we upgraded our Grafana databases in Grafana Cloud from MySQL 5.7 to MySQL 8, due to MySQL 5.7 reaching end-of-life in October. This project involved tens of thousands of customer databases across dozens of MySQL database servers, multiple cloud providers, and many Kubernetes clusters.


