Operations | Monitoring | ITSM | DevOps | Cloud
How to calculate the difference of a value over time with InfluxDB and Grafana
Learning about the past helps us understand the present, and even predict the future. So, whether you are monitoring CPU usage or how long your IoT device was powered on and then off, at some point, you might want to know the difference of a value over time. InfluxDB is an open source database for storing and retrieving time series data. Thanks to its own query languages — flux and InfluxQL — it provides different and powerful ways to analyze data.
An alternative to YAML with Grafana Agent Flow mode
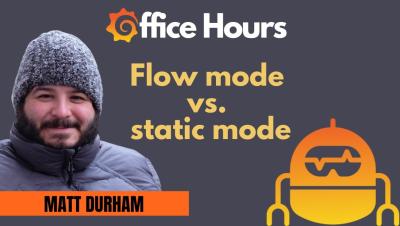
Here's the Grafana Office Hours with Matt Durham and Paul Balogh, where we discuss Grafana Agent Flow mode and how it's better than static mode: https://youtube.com/live/-_SsFLoJvoc
And check out the documentation for flow mode here: https://grafana.com/docs/agent/latest/flow/
How to use flow mode for Grafana Agent with Matt Durham (Grafana Office Hours #21)
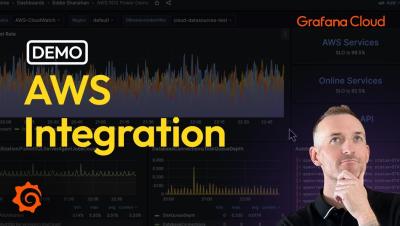
Effortlessly monitor AWS services in Grafana Cloud
New in Grafana roles: Manage user permissions better with 'No basic role'
Since we introduced role-based access control (RBAC) in Grafana 9.0, users — and later, service accounts — have been required to have an assigned role that includes a basic set of permissions. This sometimes led organizations to create users and service accounts that had more permissions than necessary. As a result, Grafana administrators had to make additional adjustments to users’ permissions on a case-by-case basis.
Building scalable OSS observability with Mimir, Loki, Tempo, and Pyroscope | ObservabilityCON 2023
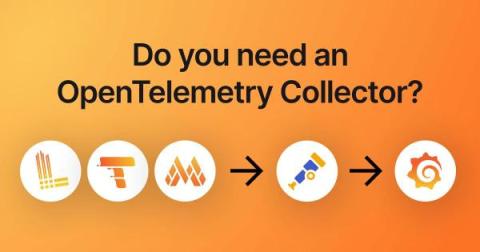
Do you need an OpenTelemetry Collector?
When you use OpenTelemetry SDKs to collect logs, metrics, and traces from infrastructure or an application, you’ll find many references to people using Grafana Agent and OpenTelemetry Collector. They start with an application or infrastructure that sends telemetry, and that data is sent to a collector, which then sends it to a backend like Grafana that may perform many functions, including visualization.
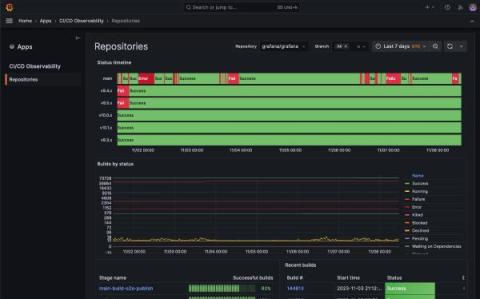
What is CI/CD observability, and how are we paving the way for more observable pipelines?
Observability isn’t just about watching for errors or monitoring for basic health signals. Instead, it goes deeper so you can understand the “why” behind the behaviors within your system. CI/CD observability plays a key part in that. It’s about gaining an in-depth view of the entire pipeline of your continuous integration and deployment systems — looking at every code check-in, every test, every build, and every deployment.


