Operations | Monitoring | ITSM | DevOps | Cloud
How to download and run Grafana on your MacOS - Grafana for Beginners Ep.4
Easily page participants to accelerate incident response in Grafana IRM
Incidents almost never happen in a vacuum. When you receive an alert about a potential issue, odds are pretty good that you’ll need to navigate between different tools and teams to get things resolved. Of course, timing is critical in these situations, so the easier it is to communicate — between both tools and teams — the better off you’ll be.
'The Story of Grafana' documentary: The community behind the code
How do you know that your open source project has been enthusiastically adopted by the community? A) Engineers give you a raucous standing ovation when a feature is revealed. B) People form a long line to meet you at an industry event. C) Every time there is a release, social media notifications blow up your phone. If you’re Grafana founder Torkel Ödegaard, the answer is D) all of the above.
What is Grafana Loki? #observability
The Story of Grafana | Episode 2: Community | Grafana Documentary
Open source log monitoring: The concise guide to Grafana Loki
Five years ago today, Grafana Loki was introduced to the world on the KubeconNA 2018 stage when David Kaltschmidt, now a Senior Director of Engineering at Grafana Labs, clicked the button to make the Loki repo public live in front of the sold-out crowd. At the time, Loki was a prototype: We bolted together Grafana as a UI, Cortex internals, and Prometheus labels to find out if there was a need for a new open source tool to manage logs.
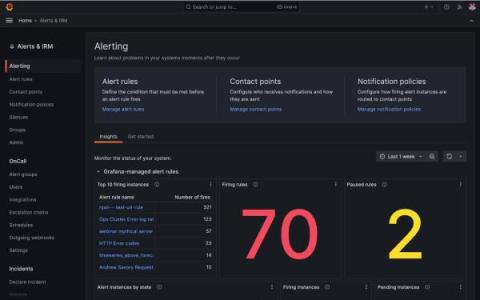
Grafana Alerting: How to monitor alerts for better alert management
With the release of Grafana 10.2, we made a number of enhancements to Grafana Alerting. These updates included the rollout of Insights, a new section of the Grafana Alerting home page. Available now to all Grafana Cloud users, Insights offers valuable information, such as statistics on alert rules and notifications, to help you monitor alerting data and quickly analyze alert performance.
Traces to metrics: Ad hoc RED metrics in Grafana Tempo
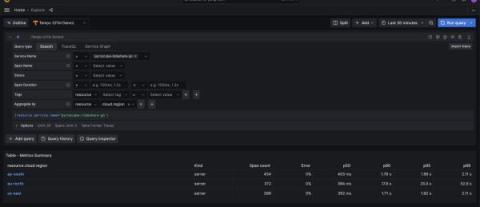
Traces to metrics: Ad hoc RED metrics in Grafana Tempo with 'Aggregate by'
In observability, finding the root cause of a problem is sometimes likened to finding a needle in a haystack. Considering that the problem might be visible in only a tiny fraction of millions or billions of individual traces, the task of reviewing enough traces to find the right one is daunting and often ends in failure.


