Operations | Monitoring | ITSM | DevOps | Cloud

Grafana

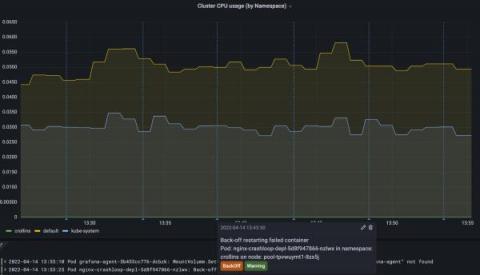
New in the Kubernetes integration for Grafana Cloud: Kubernetes events, Pod logs, and more

The Kubernetes integration for Grafana Cloud helps users easily monitor and alert on core Kubernetes metrics using the Grafana Agent, our lightweight observability data collector optimized for sending metric, log, and trace data to Grafana Cloud. It packages together a set of easy-to-deploy manifests for the Agent, along with prebuilt dashboards and alerts.

Video: How to migrate to Grafana Mimir in less than 4 minutes

Since we launched Grafana Mimir — the most scalable, most performant open source time series database in the world — we have answered many of your questions about our latest open source project, including how to pronounce it. (All together now: /mɪ’mir/.) We have also walked through how we scaled Grafana Mimir to 1 billion active series.

eCommerce giant Blinkit's journey from ELK Stack to Grafana Cloud

The promise: Order any groceries and essentials from Blinkit’s mobile app, and they’ll be delivered to your doorstep within 10 minutes. The process: Very difficult with a legacy logging tool. For Blinkit, the instant delivery service formerly known as Grofers that serves millions of consumers across India, their tech stack was beginning to interfere with business operations at a time when the company was hyperscaling due to its popularity.

New in Grafana 8.5: updated panels, new RBAC features, simplified reporting, and more!

Grafana 8.5 is here! Download Grafana 8.5 We’ve worked on a variety of improvements that focus on Grafana’s usability, data visualization, and security. For a full list of new features and capabilities, check out our What’s New in Grafana 8.5 documentation. You can get started with Grafana in minutes with Grafana Cloud. We have free and paid Grafana Cloud plans to suit every use case — sign up for free now.

How Grafana Mimir's split-and-merge compactor enables scaling metrics to 1 billion active series

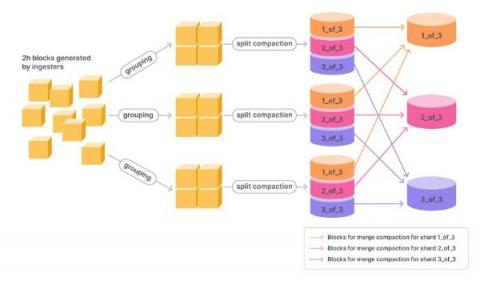
Grafana Mimir, our new open source time series database, introduces a horizontally scalable split-and-merge compactor that can easily handle a large number of series. In a previous blog post, we described how we did extensive load testing to ensure high performance at 1 billion active series. In this article, we will discuss the challenges with the existing Prometheus and Cortex compactors and the new features of Grafana Mimir’s compactor.

Service level objectives: How SLOs have changed the business of observability

Forget the latest tech gadgets and the newest products. One of the most talked about trends in observability right now? “SLOs have really become a buzzword, and everyone wants them,” said Grafana Labs principal software engineer Björn “Beorn” Rabenstein on a recent episode of “Grafana’s Big Tent,” our new podcast about people, community, tech, and tools around observability.

Video: Get started with Grafana Mimir in minutes

Since we launched Grafana Mimir — the most scalable, most performant open source time series database in the world — we have answered many of your questions about our latest open source project, including how to pronounce it. (All together now: /mɪ’mir/.) We have walked through how we scaled Grafana Mimir to 1 billion active series. And we will be hosting webinars to showcase cutting-edge features like query sharding and the two-stage compactor.

The ins, outs, and benefits of using Grafana Loki as a backend logging solution

As organizations have moved from monolithic to microservice-based architectures, there has been an explosion in the volume of logs generated. Most logging solutions create a full index of the logs and use SSD drives, which results in costly compute and storage resources for logs that are mostly write once, read never. We created Grafana Loki to solve these problems. Loki only indexes the metadata of the log lines, relies on inexpensive object storage, and is architected for scalability. In addition, Loki takes advantage of parallelism and sharding that results in fast query performance. In this session, we will discuss the benefits of using Loki as a backend logging solution.

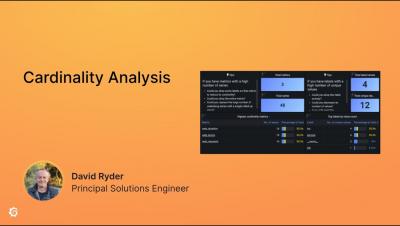
Analyzing Cardinality in Grafana Cloud and Grafana Enterprise Metrics

Cardinality Analysis of metrics is an enabler to reducing costs and focusing observability on the necessary metrics to identify and investigate where issues are occurring in your services. Grafana has added cardinality management dashboards to Grafana Cloud and Grafana Enterprise Metrics to make this an easy and fast process. In this introductory session, we will provide an overview of the Grafana Cardinality features and offer a set of discovery questions to help you with the process.

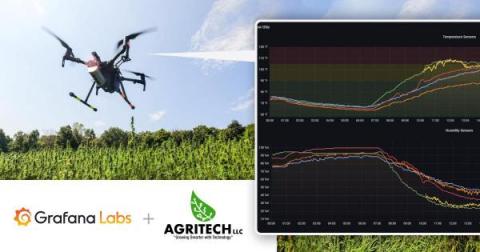
How AgriTech used IoT and Grafana to help industrial hemp farmers hit a new production high

In 2019, Alexander Mann was working in the microchip industry, putting in 12-hour shifts that left no time for him to tend to his large vegetable garden. “I started looking for ways that I could remotely water or check on my plants,” he says. Products that could help him were either too costly for a hobby gardener or required special internet connections, so Mann decided to learn about IoT and create his own setup.