Operations | Monitoring | ITSM | DevOps | Cloud

InfluxData

TL;DR InfluxDB Tech Tips: IoT Data from the Edge to Cloud with Flux

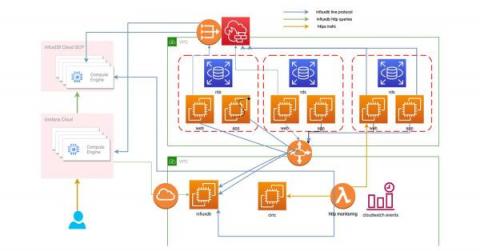
When it comes to writing data to InfluxDB, you have a lot of options. You can: The last bullet is the most powerful and flexible way of maintaining and managing your fleet of IoT devices. That architecture offers you several advantages including: Architecture drawing of the last bullet. Sensors write data to an OSS instance of InfluxDB at the edge which in turn write data to InfluxDB Cloud.

Getting Started with Java and InfluxDB

Time series data is becoming vital, from IoT devices’ sensors to financial processing. The data collected from these sources can help in sales forecasting and making informed decisions about marketing and financial planning. In this article, you will learn about InfluxDB, one of the most efficient time series databases currently available, and explore how to use InfluxDB with Java.

PTC Kepware and InfluxDB: Collecting and Storing Your Automation Data

If you have worked in the automation sector for some time, it is likely you have come across or at least heard of PTC Kepware. They provide one of the largest connectivity suites for automation devices such as PLC’s easing the bridge between the OT (Operation Technology) and IT (Information Technology) world. The best part? You can store, transform and visualize this data using InfluxDB. This blog post will take you through the different ways of connecting your Kepware instance to InfluxDB.

How to Use AWS Lambda Serverless Functions with InfluxDB

For time series workloads the ability of serverless functions to scale up and down is a major advantage, especially for something like IoT devices that may have intermittent connectivity and might suddenly send data in bursts. In this type of situation, it doesn’t make sense to be paying for a server to be running 24/7 when you can use a serverless function and only pay for the compute you use.

Getting Started with the InfluxDB 2.0 API and Postman

Whether you’re using InfluxDB Cloud or InfluxDB OSS, the InfluxDB API provides a simple way to interact with your InfluxDB instance. The InfluxDB v2.0 API offers a unified approach to querying, writing data to, and assessing the health of your InfluxDB instances. Today we want to share a Postman project to help you use the API easily. Postman is “an API platform for building and using APIs”.

Expand Kubernetes Monitoring with Telegraf Operator

Monitoring is a critical aspect of cloud computing. At any time, you need to know what’s working, what isn’t, and have the ability to respond to changes occurring in a given environment. Effective monitoring begins with the ability to collect performance data from across an ecosystem and present it in a useful way. So the easier it is to manage monitoring data across an ecosystem, the more effective those monitoring solutions are and the more efficient that ecosystem is.

Plugin Spotlight: Exec & Execd

Telegraf comes included with over 200+ input plugins that collect metrics and events from a comprehensive list of sources. While these plugins cover a large number of use cases, Telegraf provides another mechanism to give users the power to meet nearly any use case: the Exec and Execd input plugins. These plugins allow users to collect metrics and events from custom commands and sources determined by the user.

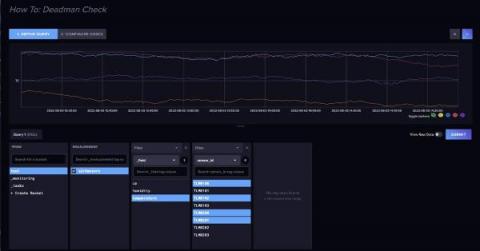
TL;DR InfluxDB Tech Tips - Visualizing Uptime with Flux deadman() Function in InfluxDB Dashboards

A common DevOps use case involves alerting when hosts stop reporting metrics, aka a deadman alert. This can be done using the monitor.deadman() Flux function. One can easily create a deadman (or threshold) check in the InfluxDB UI Alerts section or craft a custom task to alert as well. Check out InfluxDB’s Checks and Notifications system post for more details. It’s also possible to use the monitor.deadman() function directly in a dashboard cell.

Data Visualization Made Easy with ReactJS, Nivo and InfluxDB

If a picture is worth a thousand words, then a well-done data visualization is worth a million. The quality of a dashboard can make or break an application. In this tutorial, you will learn how to make high-quality data visualizations easily by using the Nivo charting library with ReactJS. You will also learn how to query data stored in InfluxDB to make your charts dynamic and versatile.