Operations | Monitoring | ITSM | DevOps | Cloud

January 2021

How we live-migrated massive Cortex clusters to blocks storage with zero impact to Grafana Cloud customers

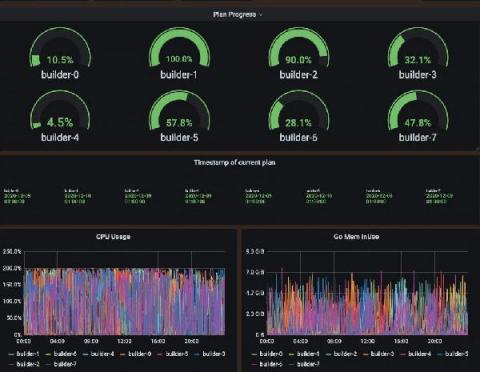
January 20, 15:01 UTC. I was sitting in my home office, watching the screen and feeling a mix of emotion and nostalgia as a pod was getting terminated. We have thousands of pods, continuously starting and terminating, and I’m definitely not spending my days watching them, so why was this one special? The terminating ingester-0 pod was the very last Cortex ingester running on chunks storage in Grafana Labs’ infrastructure.

How to get started quickly with the new synthetic monitoring feature in Grafana Cloud

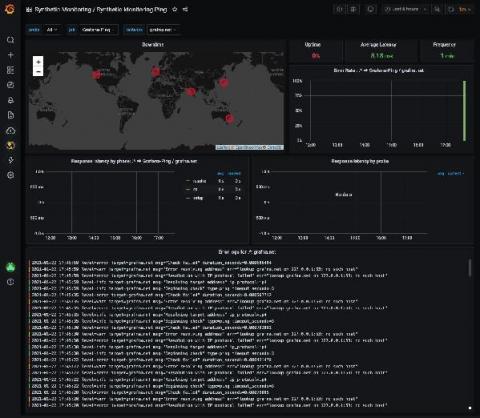
We recently launched synthetic monitoring, which helps you understand your users’ experience and improve website performance by proactively monitoring your services. This feature, which surfaces the powerful capabilities of Prometheus blackbox exporter, is the next iteration of worldPing.

How to connect and monitor your Raspberry Pi with Grafana Cloud

The Raspberry Pi is a popular and inexpensive device that comes in many shapes and forms. It’s a popular hobbyist tool that is generally purchased to run all kinds of software experiments on. But make no mistake, even though a Raspberry Pi comes in a tiny form factor, it’s a fully functional computer!

A beginner's guide to distributed tracing and how it can increase an application's performance

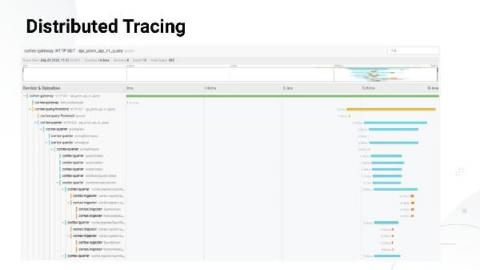
Most people are instrumenting their applications, with logs being an easy first step into the observability world, followed by metrics. Tracing lags behind these two and is maybe a little less used than other observability patterns. We hope to change that.

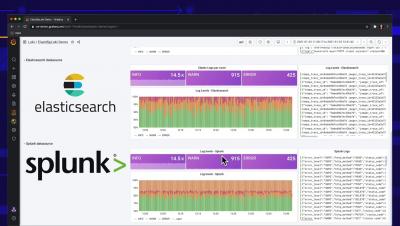
Unify your data with Grafana, wherever it lives: The ElastiSpLoki dashboard

At Grafana Labs, we believe you should unify your data, not your database. We want to help you with your observability, not own it But what if you have multiple teams using multiple open source and commercial solutions? Not a problem. To give an example, here is a quick demo of Splunk, Elastic, and Loki logs combined into one UI in #Grafana This is more than a dashboard; it's a composite panel with transformations of all three sources Your teams should be able to use best-of-breed technologies rather than being locked into one

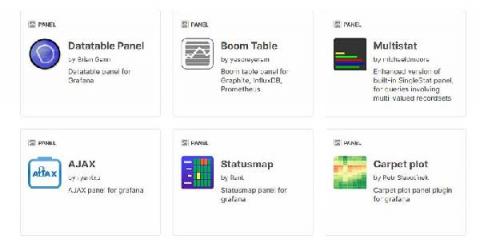
6 tips for improving your Grafana plugin before you publish

Are you putting the final touches on your plugin before you submit it to the Grafana plugin page? In this article, I’ll share a few tips for how to add that extra polish to your plugins. This article assumes that you already have some knowledge of building plugins for Grafana. If you’re looking to build your first plugin, start by following one of our plugin tutorials.

How Prometheus monitoring mixins can make effective observability strategies accessible to all

Three years ago, Tom Wilkie and Frederic Branczyk sketched out the idea for Prometheus monitoring mixins. This is a jsonnet-based package format for grouping and distributing logically related Grafana dashboards with Prometheus alerts and rules. The premise was that the observability world needed a way for system authors to not only emit metrics, but also provide guidance on how to use those metrics to monitor their systems properly.

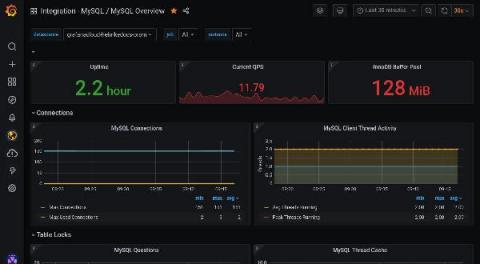
How to get started quickly with metrics, logs, and traces using Grafana Cloud integrations

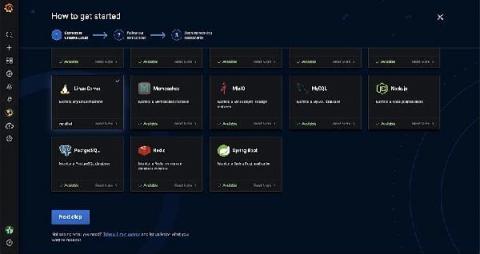
Grafana Cloud is the easiest way to get started observing metrics, logs, traces, and dashboards. When we say “easiest,” we mean it: Grafana Cloud is designed so that even novice observability users can use it. As a new user, you are not required to dive into the complexity of setting up Prometheus and figuring out how to create Grafana dashboards from scratch. Integrations are the reason why.

The new Grafana Cloud: the only composable observability stack for metrics, logs, and traces, now with free and paid plans to suit every use case

Oftentimes users of open source are told to go download it and figure it out… or pay for a managed solution in the cloud. So the typical choice is free and do-it-yourself or expensive and easy. With our new changes to Grafana Cloud, we are making it both free and easy to have a real, composable observability solution.

Get started with Prometheus with these three easy projects

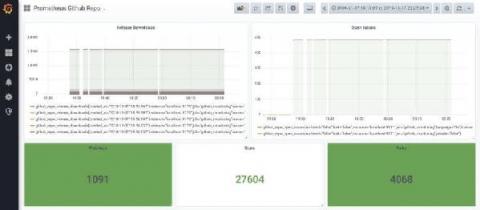
You’ve probably heard about Prometheus, the leading open source project focused on metrics and alerting, and how it has changed the way the world does monitoring and observability. But if you’re brand-new to the technology, how can you dip your toes in and get started? I was in this position not long ago myself. I am a very hands-on type of learner, and usually when I want to explore new technologies, I start with “hello world” apps and small toy projects.

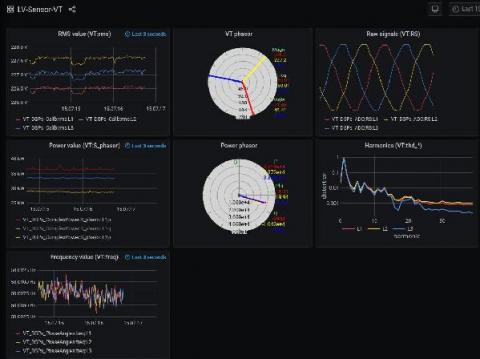
How using Grafana (and plugins) gave a jolt to Smart State Technology, a company advancing technology for energy infrastructures

Smart State Technology (SST) is a company based in the Netherlands that develops advanced technological and future-proof solutions for smart grids. Their mission is to reinforce critical energy infrastructures by providing innovative energy solutions that connect industry and research, while ensuring society can fully benefit a sustainable energy future.

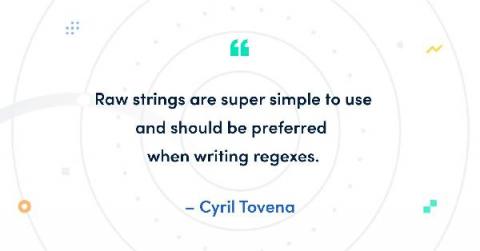
How to escape special characters with Loki's LogQL

In my ongoing Loki how-to series, I have already shared all the best tips for creating fast filter queries that can filter terabytes of data in seconds. In this installment, I’ll reveal how to correctly escape special characters within a string in Loki’s LogQL. When writing LogQL queries, you may have realized that in multiple places you have to write strings delimited by double quotes.

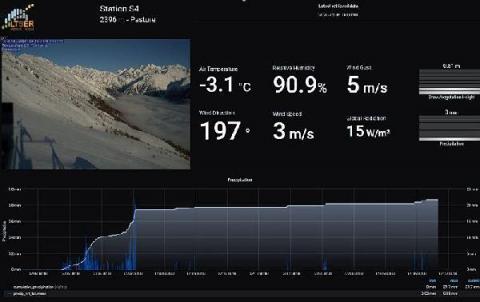
IoT monitoring with Grafana: How Eurac observes climate change in the Alps

In 2014, the Mazia (Matsch) research site in the Italian Alps was officially accepted as a Long Term Socio Ecological Research LT(S)ER site. The monitoring infrastructure is operated by Eurac Research and the University of Bolzano and consists of 24 automatic microclimatic stations in a mountain ecosystem across an elevation gradient ranging from 1,000 m to 2,700 m, logging several meteorological and biophysical variables every 15 minutes.