Operations | Monitoring | ITSM | DevOps | Cloud

February 2023

Grafana 9.4 release: Easy data source setup, custom panels, Grafana Alerting updates, and more

Grafana 9.4 is here! Get Grafana 9.4 With the latest Grafana release, we’re introducing a wealth of new features and improvements that makes getting started with Grafana even easier and that take your visualizations and observability best practices to the next level. In addition to enabling TraceQL, the new query language for distributed tracing in Grafana Tempo 2.0, for all Grafana Cloud users, the Grafana 9.4 release comes with a fresh round of features.

How Siemens Mobility is moving its trains into the future with Grafana Enterprise

Railway passengers may think of trains simply as a way to get from one place to another, but at Siemens Mobility — a rail transportation company dedicated to delivering sustainable, smart transport — they are that and much more. Siemens Mobility works with more than 3,000 partners, and its customers include Eurostar and Trans Pennine Express. In the U.K., Siemens Mobility maintains about 500 train units and logs 65 million passenger miles per year.

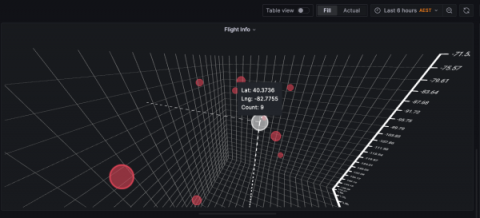
Introducing the XYZ chart: A three-dimensional way to visualize your data in Grafana

This panel is in alpha version and still in development. To use it as is, you need to modify your configuration file and set enable_alpha = true in the panels section. More information can be found on this page. Two-dimensional graphics are the de facto way to visualize data within the observability realm, and Grafana is really good at plotting data this way.

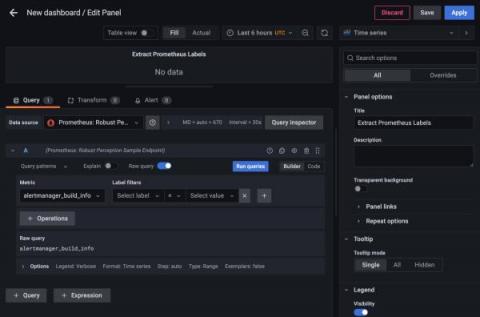
How to extract label values from Prometheus metrics in Grafana

Prometheus metrics are usually visualized as numeric values on a graph, with the metrics categorized by labels. But what do you do when the numerical value doesn’t matter, and all of the information is in the labels? In that case, you might need to visualize the labels themselves. This scenario can arise because you’re not always in control of how the metrics get reported, but you do often need to visualize what’s there.

How Wells Fargo modernized its observability stack with Grafana Enterprise and Grafana Cloud

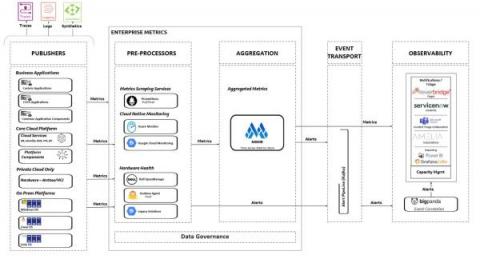
Think of a monitoring tool — any monitoring tool. Got it? Good. Odds are, whatever came to mind was probably being used behind the scenes at Wells Fargo not too long ago. “You name it, and we probably had it at Wells Fargo,” said Senior Software Engineering Manager Nikhilesh Tekwani of the complex web of observability solutions that stretched across the U.S.-based financial institution.

Why Clearco switched to Grafana Alerting, Grafana OnCall, and Grafana Incident

Working with technology means dealing with incidents or outages from time-to-time, so staying on top of problems is essential. Back in the spring of 2022, Clearco, the world’s largest e-commerce investor, had an alerting system set up to catch issues, except they had one problem: Clearco’s Customer Success team would learn of a problem before a notification even went off.

Breathing easy with Grafana dashboards and 3D printing

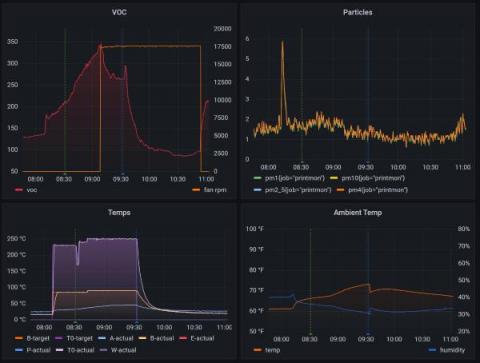
I lead the Grafana Loki project here at Grafana Labs, and I’ve always loved building things professionally and in my personal life, whether we’re talking about metalworking or coding — or, more recently, 3D printing. A couple years ago, I purchased my first 3D printer, a Prusa i3 MK3S+. I use it periodically to build functional items I use around my house in Upstate New York. For example, I recently decided to build a solar radiation shield for my outdoor weather station.

Load testing Grafana k6: Peak, spike, and soak tests

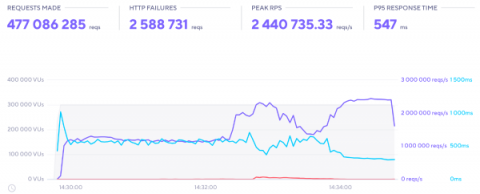
With k6 Cloud, Grafana Labs is in the business of generating load — lots of load, distributed across a cluster of computers. So while our customers care about the systems they load, we care that our system can generate the load that they need and process the test metrics for them in an intuitive, explorable way.

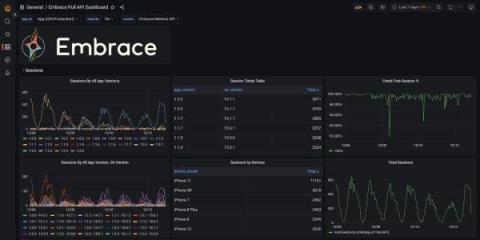
Visualize real-time mobile app data with the Embrace data source plugin for Grafana

Customers choose Embrace to help mobile development teams build fantastic mobile app experiences. Embrace provides best-in-class mobile insights that help users prioritize, understand, and resolve issues. All of which leads to better development decisions. But in modern software engineering, no team exists in a vacuum.

Watch: How to pair Grafana Faro and Grafana k6 for frontend observability

Grafana Faro and xk6-browser are both new tools within the Grafana Labs open source ecosystem, but the pairing is already showing a lot of potential in terms of frontend monitoring and performance testing. Faro, which was announced last November, includes a highly configurable SDK that instruments web apps to capture observability signals that can then be correlated with backend and infrastructure data.

How we reduced flaky tests using Grafana, Prometheus, Grafana Loki, and Drone CI

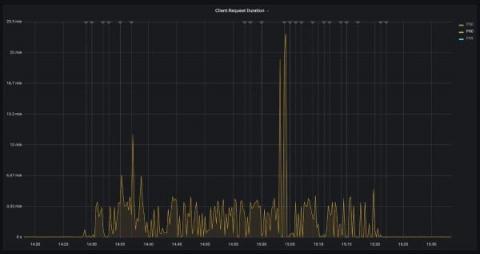
Flaky tests are a problem that are found in almost every codebase. By definition, a flaky test is a test that both succeeds and fails without any changes to the code. For example, a flaky test may pass when someone runs it locally, but then fails on continuous integration (CI). Another example is that a flaky test may pass on CI, but when someone pushes a commit that hasn’t touched anything related to the flaky test, the test then fails.

Inside ObservabilityCon: 'I picked up so much practical information'

I’ve always been wary about vendor events. In my experience, many of them are mostly marketing pitches, with little or no content that is applicable to my use cases. Despite that, last year I decided to convince my manager to let me attend ObservabilityCON 2022 to see what I could learn from it. My hope was that I would be able to get practical knowledge that could be applied as soon as I got back to work. (Spoiler alert: I did!)

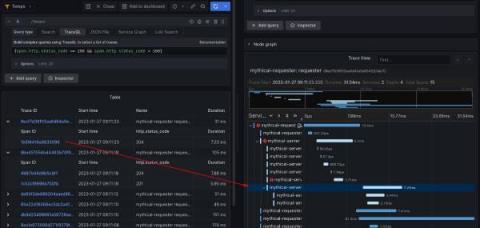
Get to know TraceQL: A powerful new query language for distributed tracing

At Grafana Labs, we love tracing, which is why we’ve been hard at work on Grafana Tempo, an open source, highly scalable distributed tracing backend. Tempo just had its 2.0 release. In conjunction with that release, we are excited to show off TraceQL — a powerful new query language designed for distributed tracing. In this blog, we’ll provide an overview of why we created TraceQL, how it works, how you can put it to use today, and what we have planned for future iterations.

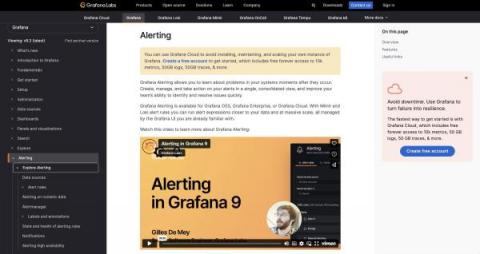
Grafana documentation: A look at the new and improved design

We recently launched a new design for our technical documentation. The goal of the redesign was to make our technical documentation more accessible, modern, and scalable as we grow. In addition to a new look (hello, new typeface and layout!), our updated docs pages reveal the underlying work our team has done to evolve and enhance our technical documentation.

How Grafana Labs uses and contributes to OpenCost, the open source project for real-time cost monitoring in Kubernetes

While more and more teams are adopting Kubernetes as their standard container orchestration technology, cost insight is lacking. Teams often don’t know how much they’re spending, where in their organization they are spending, or what is driving their infrastructure cost increases. OpenCost helps alleviate this problem by bringing real-time cost monitoring to Kubernetes workloads with a solution that encompasses both an open specification and an open source project.

New in Grafana Tempo 2.0: Apache Parquet as the default storage format, support for TraceQL

Grafana Tempo 2.0 is finally here, and it’s being released with two new important features. It took us longer than we would have liked to get this release going, but it turns out that rewriting your backend AND building a new query language is quite difficult. Thanks to a massive team effort, we are proud to release Tempo with support for TraceQL and with Apache Parquet as the default backend storage format. Read on to get a quick overview of this huge release.

Grafana Agent v0.31 release: new Helm chart, Flow support for Grafana Phlare, and more

Here at Grafana Labs, we aim to create products which integrate well with open standards and are easy to install everywhere. Today, we’re excited to announce Grafana Agent v0.31, which allows you to connect to even more types of observability signals for both scraping and remote writes. And to help you install the Agent more easily, there is now an official Windows Docker image and an official Helm Chart. Here’s a breakdown of the latest features and upgrades in Grafana Agent v0.31.