Operations | Monitoring | ITSM | DevOps | Cloud

August 2021

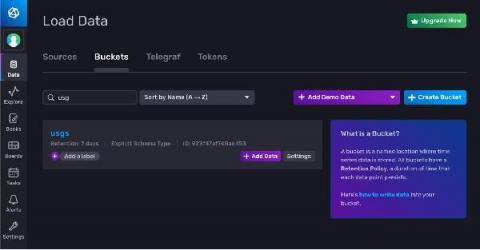
New Bucket Schema Option Can Protect You From Unwanted Schema Changes

One of the best things about getting started with InfluxDB over traditional relational databases is the fact that you don’t need to pre-define your schema in order to write data. This means you can create a bucket and write data in seconds, which can be pretty powerful to developers who care way more about the application they’re building than the mechanics of storing the data.

Getting Started with C# and InfluxDB

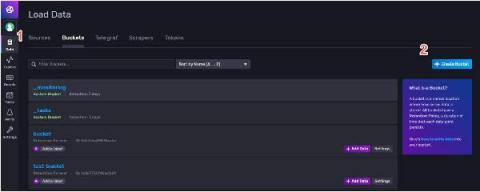
This post was written by James Hickey. Scroll below for full bio and picture following this article. Time series databases (TSDBs) can transform the way you handle streams of data in real time or IoT applications. In this tutorial, you’ll learn how to set one up in a C# application. Relational databases have their place. They’re great at things like data normalization, avoiding duplication, indexing over specific data points (like columns), and handling atomic changes to the schema.

Windows System Monitoring Dashboard in 5 Minutes

This video demonstrates how to quickly build a dashboard to monitor a Windows system. The dashboard shows various metrics like uptime, processor and memory utilization, disk IO, network, etc. All the values are stored in InfluxDB for advanced analysis using full history. This video shows a whole end-to-end process that only takes 5 minutes. It begins with the Windows template installation and Telegraf agent installation and configuration that captures all the metrics from the monitored machine(s).

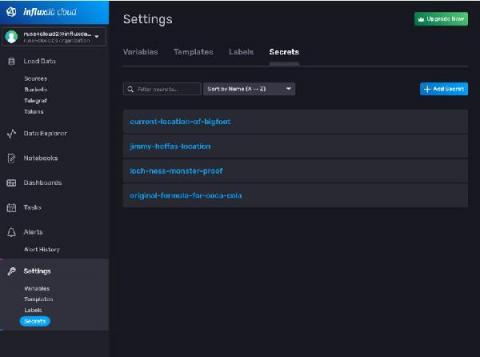
Managing Secrets in the Browser in InfluxDB Cloud

Directly embedding passwords and API keys into the code you write is a bad practice. Of course, everyone knows this, but I’ll be the first to admit that it still happens now and then. In the world of source control and shared codebases, leaking a password can be a huge problem that costs your team time and money. Of course, today many companies leverage a secrets management system to lower the probability of something like this happening.

TL;DR InfluxDB Tech Tips - Aggregating across Tags or Fields and Ungrouping

So you’re interested in time series databases, and you decided to explore InfluxDB Cloud or InfluxDB v2. Perhaps you just created a free account or downloaded the binary, and now you’re playing around with the InfluxDB User Interface (UI) and learning Flux. The hardest thing for beginners to understand are the return results from a Flux query or Annotated CSV.

Introducing Ranged Annotations in InfluxDB Cloud

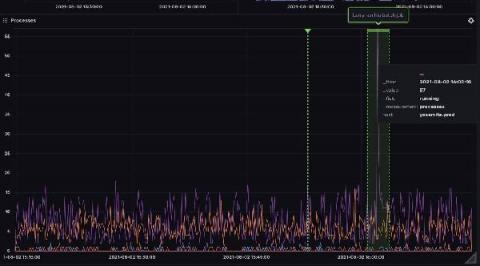
Adding annotations to your data is a great way to share context with other members of your team. In May, we added the ability to annotate individual points in your data. Today, we have added the ability to add ranged annotations to your dashboard graphs. We’ve also reworked some of the interactions with annotations based on user feedback so that they can be added quickly and easily. To learn more about working with annotations, check out our documentation.

Use InfluxDB with GitHub Actions for GitOps, CI/CD, and Data Transformation

GitHub Actions are a powerful way to add automation to any source code repository. When you take that power and connect it with InfluxDB, you get an amazing combination that allows you to automate data generation, manage GitOps workflows, and a whole lot more. This post will highlight some of the interesting ways to use InfluxDB and GitHub Actions.

Visualize Geotemporal Data with InfluxDB Cloud's New Map Graph

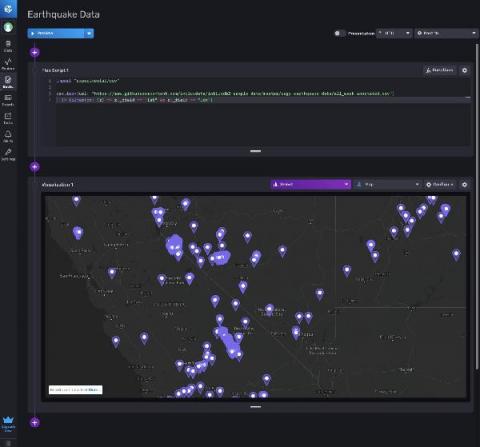
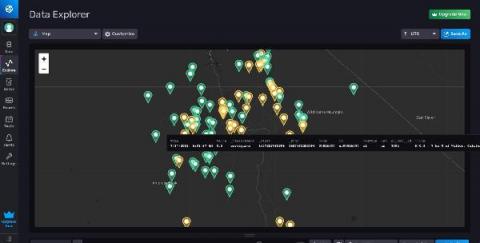
We recently introduced a new Map graph type into InfluxDB Cloud to help users visualize time series data that includes position. Above is a graph showing the most recent earthquakes in California, where the color of the marker indicates their magnitude. In this post, I’m going to walk through the ways to ingest geotemporal data into InfluxDB Cloud, and how to use the new Maps visualization type.