Visualize & Create Dashboards With Grafana In GroundWork Monitor
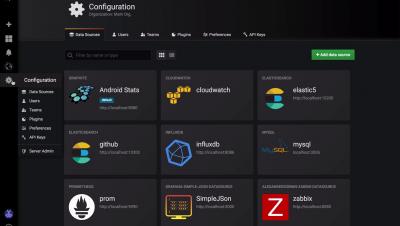
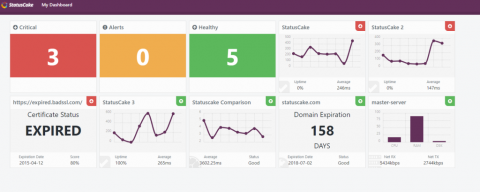
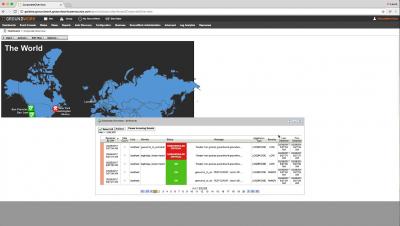
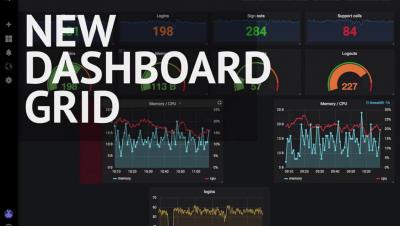
This webinar presented by GroundWork Open Source shows users how to gather and visualize data in a clear, flexible way using Grafana dashboards in GroundWork Monitor. We'll show you how to gather data from any source, including time series data. We'll also walk through how to set your own thresholds and alerts. Presented by GroundWork Open Source founder and vice-president of product strategy, Thomas Stocking.

