Operations | Monitoring | ITSM | DevOps | Cloud

Latest Blogs

How to Improve Your Citrix Deployment by Monitoring Pilot Phases

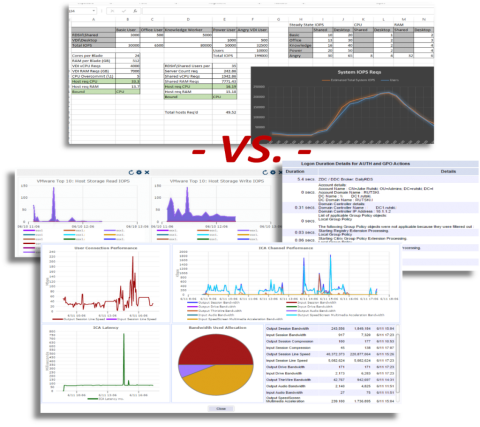
We all want seamless rollouts of Citrix XenApp/XenDesktop and we use a number of tools to achieve that reality. I have found a unique software that allows me to proactively understand the performance impact of Citrix XenApp/XenDesktop on the IT infrastructure and ultimately end user experience early in the Citrix deployment lifecycle. In this post I will show you four examples of how I use the software to avoid potential issues.

Reduce Your IT Alert Noise and Fatigue

Two of the biggest IT headaches we hear about here at Zenoss are alert noise and fatigue. To help combat these, we co-developed an integration with PagerDuty to help enterprises successfully overcome these pain points. Recently, we launched the updated version of the PagerDuty ZenPack using PagerDuty’s v2 API and certification for Zenoss Cloud.

How to install a High Availability Database Cluster with Pandora FMS

Pandora FMS relies on a MySQL database for configuration and data storage. A database failure can temporarily bring your monitoring solution to a halt. The Pandora FMS high availability database cluster allows you to easily deploy a fault-tolerant, robust architecture.

Sentry's New Java Agent: Adding Context to Your Stack Traces

We’re enhancing the existing Sentry Java SDK with our new Java agent. The thing is — it’s still in beta, and we need your feedback. Once downloaded, the agent will enhance your application stack traces on Sentry by adding the names and values of local variables to each frame. Specifically, the agent provides much more detail about the current state of the application at the time of the error than you would usually have.

Key metrics for Elasticsearch performance monitoring

Elasticsearch is a highly scalable, distributed, open-source RESTful search and analytics engine that offers log analytics, real-time application monitoring, click stream analytics, and more. Elasticsearch stores and retrieves data structures in real time. It has multi-tenant capabilities with an HTTP web interface, presents data in the form of structured JSON documents, makes full-text search accessible via RESTful API, and maintains web clients for languages like PHP, Ruby, .Net, and Java.

Jenkins in a Nutshell

In many projects, the product development workflow has three main concerns: building, testing, and deployment. Each change to the code means something could accidentally go wrong, so in order to prevent this from happening developers adopt many strategies to diminish incidents and bugs. Jenkins, and other continuous integration tools (CI) are used together with a source version software (such as GIT) to test and quickly evaluate the updated code.

Monitoring Java using JMX and custom metrics

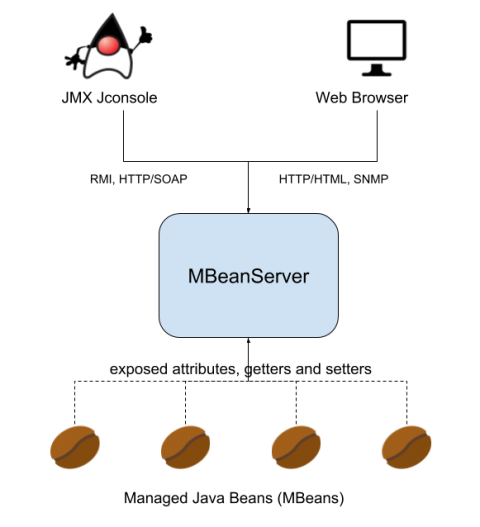
JMX (Java Management Extensions) is a set of specifications conceived to monitor and manage Java applications. To implement the JMX technology, you need to create and register MBeans (Managed Beans) as part of your Java code. Using JMX technology and tools, Java application developers can get the dynamic state of the application and use it for performance tuning, troubleshooting and debugging.