Operations | Monitoring | ITSM | DevOps | Cloud

Latest Posts

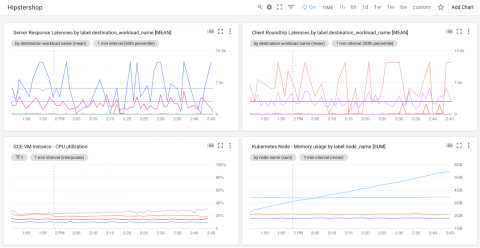
SLOs with Stackdriver Service Monitoring

Service Level Objectives or SLOs are one of the fundamental principles of site reliability engineering. We use them to precisely quantify the reliability target we want to achieve in our service. We also use their inverse, error budgets, to make informed decisions about how much risk we can take on at any given time. This lets us determine, for example, whether we can go ahead with a push to production or infrastructure upgrade.

How to use Stackdriver monitoring export for long-term metric analysis

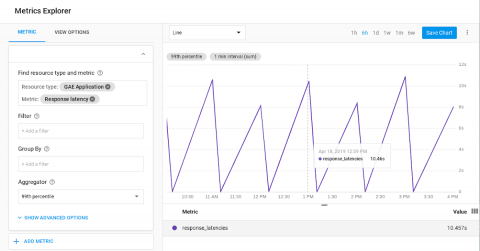
Our Stackdriver Monitoring tool works on Google Cloud Platform (GCP), Amazon Web Services (AWS) and even on-prem apps and services with partner tools like Blue Medora’s BindPlane. Monitoring keeps metrics for six weeks, because the operational value in monitoring metrics is often most important within a recent time window. For example, knowing the 99th percentile latency for your app may be useful for your DevOps team in the short term as they monitor applications on a day-to-day basis.

Monitoring Kubernetes Clusters on GKE (Google Container Engine)

The Kubernetes ecosystem contains a number of logging and monitoring solutions. These tools address monitoring and logging at different layers in the Kubernetes Engine stack. This document describes some of these tools, what layer of the stack they address, as well as best practices for implementation including an example from the field, a quick start, and a demo project.

Downsampling and Exporting Stackdriver Monitoring Data

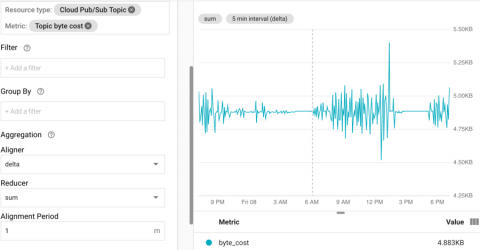
Stackdriver Monitoring contains a wealth of information about cloud resource usage, both for Google Cloud Platform (GCP) and and other sources. This post will explain how to use the Stackdriver Monitoring API to read, downsample, and export data from Stackdriver to BigQuery. Pub/Sub metrics will be used to demonstrate this.

The service mesh era: Using Istio and Stackdriver to build an SRE service

Just to recap, so far our ongoing series about the Istio service mesh we’ve talked about the benefits of using a service mesh, using Istio for application deployments and traffic management, and how Istio helps you achieve your security goals. In today’s installment, we’re going to dig further into monitoring, tracing, and service-level objectives.

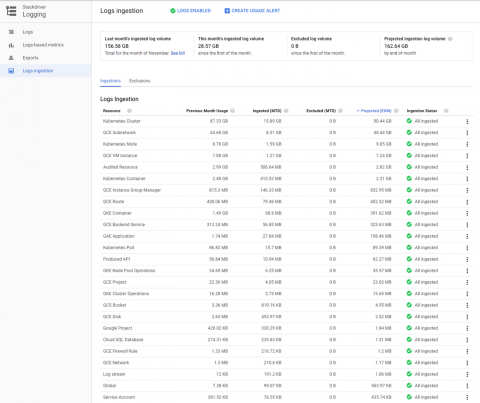
Stackdriver usage and costs: a guide to understand and optimize spending

Google Stackdriver is a cloud-based managed services platform designed to give you visibility into app and infrastructure services. Stackdriver’s monitoring, logging and APM tools make it easy to navigate between data sources to view performance details and find the root causes of any issues.

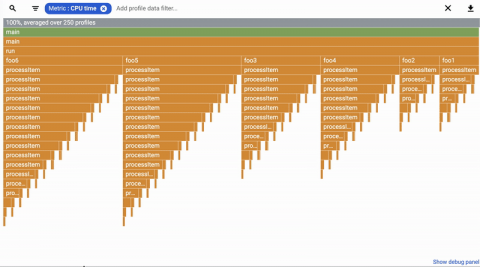
Stackdriver Profiler adds more languages and new analysis features

Historically, cloud developers have had limited visibility into the impact of their code changes. Profiling non-production deployments doesn’t yield useful results, and profiling tools used in production are typically expensive, with a performance impact that means that they can only be used briefly and on a small portion of the overall code base.

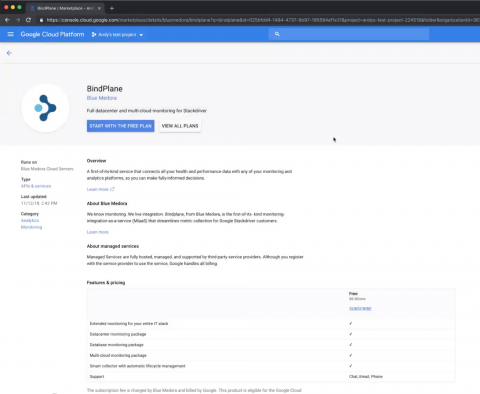
Extending Stackdriver to on-prem with the new BindPlane integration

We introduced our partnership with Blue Medora last year, and explained in a blog post how it extends Stackdriver’s capabilities. We’re pleased to announce that you can now join our new offering for Blue Medora. If you’re using Stackdriver to monitor your Google Cloud Platform (GCP) or Amazon Web Services (AWS) resources, you can now extend your observability to on-prem infrastructure, Microsoft Azure, databases, hardware devices and more.

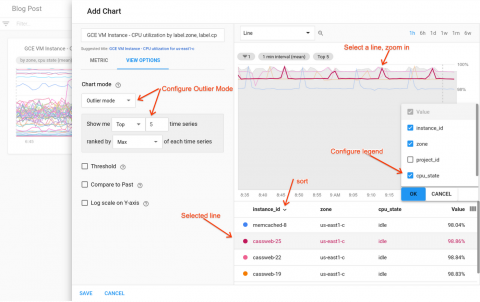
Stackdriver tips and tricks: Understanding metrics and building charts

Seeing what’s going on with your IT infrastructure, applications and services has always been critical to the success of modern businesses’ day-to-day operations. Google Stackdriver monitoring provides out-of-the-box visualizations and insights for Google Cloud Platform (GCP) users so you can easily understand your systems.

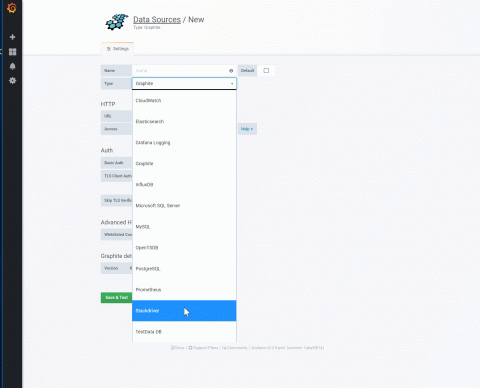
Introducing Stackdriver as a data source for Grafana

It is not uncommon to have multiple monitoring solutions for IT infrastructure these days as distributed architectures take hold for many enterprises. We often hear from Google Cloud Platform (GCP) customers that they use Stackdriver to monitor resources as well as Grafana and Prometheus for container monitoring. We’ve heard lots of requests from customers to be able to view Stackdriver data in Grafana effortlessly.