Operations | Monitoring | ITSM | DevOps | Cloud

Latest Posts

Building a more reliable infrastructure with new Stackdriver tools and partners

Every software organization faces challenges in keeping applications available and running reliably. At Google, we’ve developed and practiced a discipline known as Site Reliability Engineering (SRE). Following SRE practices lets us build and operate services reliably for our billions of users. Google has about 2,500 Site Reliability Engineers who support both internal and external services.

Using Stackdriver Workspaces to help manage your hybrid and multicloud environment

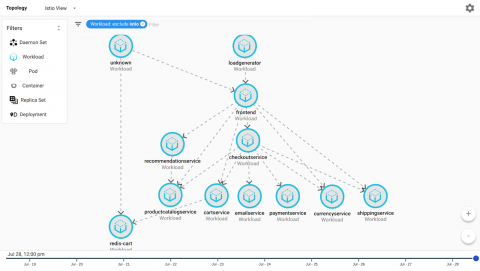
At Google, we believe strongly in an open cloud. We’re continually working to bring you tools for understanding how your applications are performing, whether they run in different projects, organizations, clouds, or even on prem. Monitoring tools like Stackdriver Kubernetes Monitoring, OpenCensus, and Stackdriver APM are designed to help you get visibility into your workloads wherever they run—on Google Cloud Platform (GCP), on-premises or on another cloud platform.

Drilling down into Stackdriver Service Monitoring

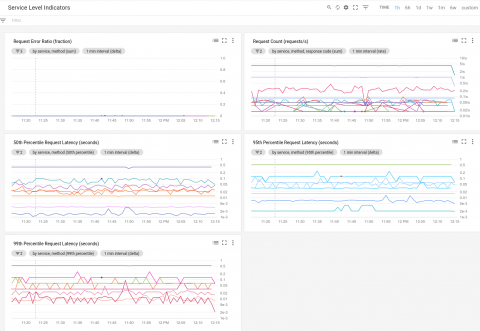
If you’re responsible for application performance and availability, you know how hard it can be to see it through the eyes of your customers and end users. We think that’s really going to change with last week’s introduction of Stackdriver Service Monitoring, a new tool for monitoring how your customers perceive your applications, and that then lets you drill down to the underlying infrastructure when there’s a problem.

Transparent SLIs: See Google Cloud the way your application experiences it

Like all good IT organizations, you religiously measure the performance and availability of your services and applications. But if those apps run in the cloud, critical components are often delivered by a third party or the cloud provider. In the case of a service disruption or degraded performance, how do you know what the problem is—your code, the network, or the provider? And, if the problem is with the service provider, how do you convince them to take action as quickly as possible?

How to connect Stackdriver to external monitoring

Google Stackdriver lets you track your cloud-powered applications with monitoring, logging and diagnostics. Using Stackdriver to monitor Google Cloud Platform (GCP) or Amazon Web Services (AWS) projects has many advantages—you get detailed performance data and can set up tailored alerts. However, we know from our customers that many businesses are bridging cloud and on-premises environments.

Try full-stack monitoring with Stackdriver on us

In advance of the new simplified Stackdriver pricing that will go into effect on June 30, we want to make sure everyone gets a chance to try Stackdriver. That’s why we’ve decided to offer the full power of Stackdriver, including premium monitoring, logging and application performance management (APM), to all customers—new and existing—for free until the new pricing goes into effect. This offer will be available starting June 18.

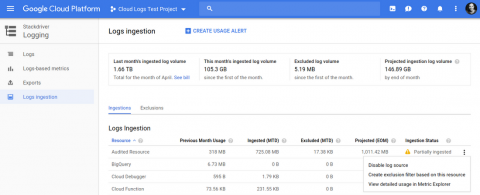
Gain visibility and take control of Stackdriver costs with new metrics and tools

A few months back, we announced new simplified Stackdriver pricing that will go into effect on June 30. We’re excited to bring this change to our users. To streamline this change, you’ll receive advanced notifications and alerting on the performance and diagnostics data you track for cloud applications, plus flexibility in creating dashboards, without having to opt in to the premium pricing tier.

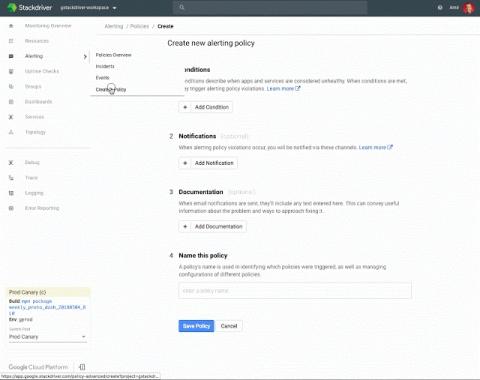
Stackdriver brings powerful alerting capabilities to the condition editor UI

We are excited to announce the beta version of our new alerting condition configuration UI. In addition to allowing you to define alerting conditions more precisely, this new UI provides an easier, more visual way to find the metrics to alert on. The new UI lets you use the same metrics selector as used in Stackdriver’s Metrics Explorer to define a broader set of conditions. Starting today, you can use that metrics selector to create and edit threshold conditions for alerting policies.

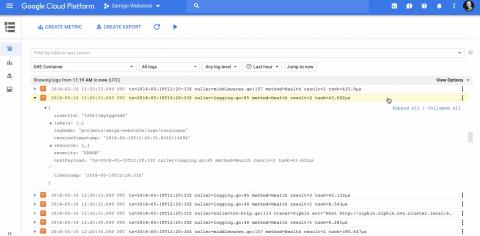
Getting more value from your Stackdriver logs with structured data

Logs contain some of the most valuable data available to developers, DevOps practitioners, Site Reliability Engineers (SREs) and security teams, particularly when troubleshooting an incident. It’s not always easy to extract and use, though. One common challenge is that many log entries are blobs of unstructured text, making it difficult to extract the relevant information when you need it.