Operations | Monitoring | ITSM | DevOps | Cloud

Latest Posts

How to Monitor Active Directory with OpenTelemetry

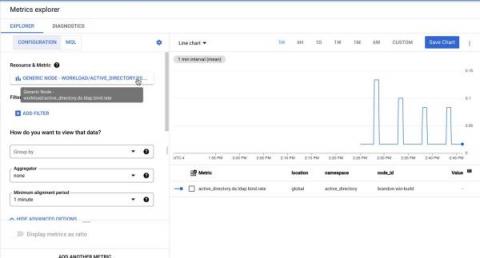
We’re excited to announce that we’ve recently contributed Active Directory Domain Services (abbreviated Active Directory DS) monitoring support to the OpenTelemetry collector. You can check it out here! You can utilize this receiver in conjunction with any OTel collector: including the contrib collector, the observIQ’s distribution of the collector, as well as Google’s Ops Agent, as a few examples.

How to monitor MongoDB with OpenTelemetry

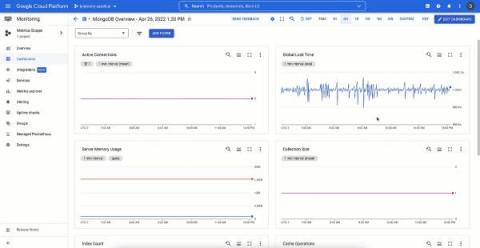
MongoDB is a document-oriented and cross-platform database that maintains its documents in the binary encoded JSON format. Mongo’s replication capabilities and horizontal capability using sharding make MongoDB highly available. An effective monitoring solution can make it easier for you to identify issues with MongoDB such as resource availability, execution slowdowns, and scalability. observIQ recently built and contributed a MongoDB metric receiver to the OpenTelemetry contrib repo.

How to Monitor Microsoft IIS with OpenTelemetry

The OpenTelemetry members at observIQ are excited to add Microsoft IIS metric monitoring support to OpenTelemetry! You can now easily monitor your IIS web servers with the oIQ OpenTelemetry Collector. You can add the IIS metric receiver to any OpenTelemetry collector. This post demonstrates just one configuration for shipping metrics with OpenTelemetry components. This configuration and many other observIQ OpenTelemetry configurations are available in the oIQ Opentelemetry Collector.

How to Monitor Riak Metrics with OpenTelemetry

observIQ’s OpenTelemetry members contributed Riak metric monitoring support to OpenTelemetry! You can now monitor your Riak agent performance with OpenTelemetry, and deploy simply with the oIQ OpenTelemetry Collector. You can add the Riak metric receiver to any OpenTelemetry collector. This post demonstrates a configuration for shipping metrics to Google Cloud Operations with OpenTelemetry components.

How to Monitor Redis with OpenTelemetry

We’re excited to announce that we’ve recently contributed Redis monitoring support to the OpenTelemetry collector. You can check it out here! You can utilize this receiver in conjunction with any OTel collector: including the contrib collector, the observIQ’s distribution of the collector, as well as Google’s Ops Agent, as a few examples.

How to collect metrics and logs for NGINX using the OpsAgent

The Ops agent is Google’s recommended agent for collating your application’s telemetry data, and forwarding them to GCP for visualization, alerting and monitoring. The Ops agent collates logs and a metrics collector into one single powerhouse. Some of the key advantages of using the Ops agent are outlined below.

What's New at observIQ

You may have noticed a few changes around here. If you explore our new website, you’ll notice new products, expansions to our open source libraries, significant contributions to our favorite open source project, OpenTelemetry, and new integrations with Google Cloud. You might just think we’re taking “new year new me” a little too seriously, but in fact we’ve been planning some of these changes for a long time. It all stems from our firm belief in open source technology.