Operations | Monitoring | ITSM | DevOps | Cloud

Latest Posts

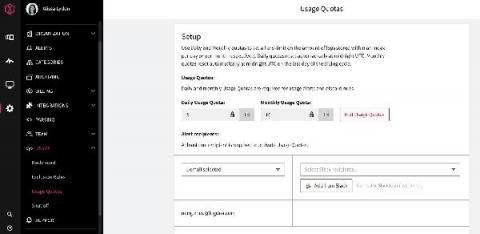
Control Your Logging Spend With Usage Quotas

We built LogDNA around the idea that developers are more productive when they have access to all of the logs they need, when they need them. However, we also know that log management can get expensive fast. And, for anyone who owns the budget for developer tools, logs can be an unpredictable line item as you try to determine your monthly, quarterly or even annual spend.

The Cost of Racing Toward Success

LogDNA recently celebrated 5 years since our launch in Y Combinator and during this half-a-decade we’ve learned several lessons about balancing cost and scalability. As a founder, here are the top 3 things I wish someone had told me as we were racing towards success. The appeal of building a cloud-native application for a startup is a no brainer—it’s agile, scalable, and can be managed by a distributed team. Not to mention, it’s the cheapest way to get off the ground.

We built LogDNA Templates so you don't have to

With an ever growing list of infrastructure improvements, new features, and issues to debug, setting up your observability tools to keep up with best practices can fall down your list of priorities. There’s simply not enough time to set up new dashboards that can give you the visibility you need to be proactive with your infrastructure.

Announcing LogDNA Agent v2.2 Beta

We’re excited to announce the public beta release of our latest Agent v2, which includes two major feature improvements for our Kubernetes® customers. First, Agent v2.2 now supports Kubernetes event logs that enable more seamless Kubernetes deployment troubleshooting. In addition, we now support running Agent v2 as a non-root user, making Agent v2 the most secure Kubernetes agent on the market.

Announcing the LogDNA Terraform Provider Beta

We’re excited to announce the public beta of the LogDNA Terraform Provider, allowing organizations to manage Views and Alerts programmatically via Terraform. Today, more teams than ever are adopting Infrastructure as Code (IaC) to reduce human error and create efficiently scaled workflows for their infrastructure. Additionally, teams are looking to bring the same benefits of scalability and predictability into their SaaS-based observability stack.

Enhancing the DevOps Experience on Kubernetes with Logging

Keeping track of what’s going on in Kubernetes isn’t easy. It’s an environment where things move quickly, individual containers come and go, and a large number of independent processes involving separate users may all be happening at the same time. Container-based systems are by their nature optimized for rapid, efficient response to a heavy load of requests from multiple users in a highly abstracted environment and not for high-visibility, real-time monitoring.

Kubernetes Logging and Monitoring: What Kubernetes Can and Can't Do Natively

Kubernetes is a container orchestration tool, but its functionality extends far beyond just orchestrating containers in a narrow sense. It offers a range of additional features that—to a limited extent—address needs such as load balancing, access control, security policy enforcement, and even logging and monitoring. Indeed, Kubernetes’s broad functionality has led some folks to call it an “operating system” in its own right.

LogDNA Best Practices

We examined best practices for logging in a prior series. However, how can you apply those best practices in real life? Let’s dive into how you could use LogDNA in an opinionated manner to utilize best practices to bring value to your DevOps-focused projects. How can we ensure we follow best practices and keep our logs secure and compliant as noted in the previous series? Let’s pretend we’re setting up centralized log management with LogDNA for a new team and project.