Operations | Monitoring | ITSM | DevOps | Cloud

Latest Posts

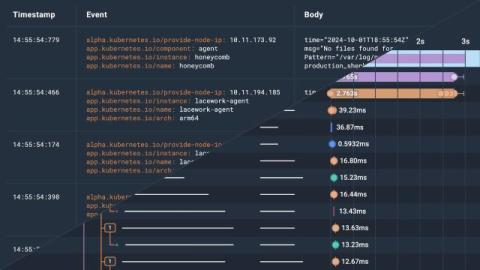
OneFootball Scores an Observability Goal with Honeycomb

For football fans worldwide, staying connected to their favorite teams, players, and matches is a passion—and OneFootball delivers exactly that. The platform is a one-stop shop for football fans to follow their teams, get up-to-date information, and immerse themselves in global football culture. With over 100 million users spanning multiple continents, OneFootball is an essential companion for fans to track live scores, player stats, breaking news, and more.

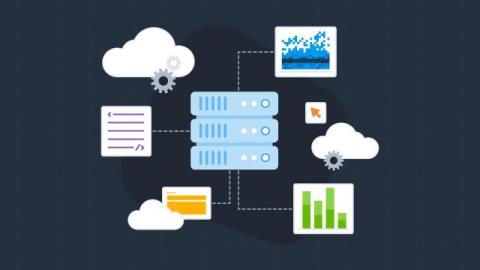
Beyond Monitoring: A Guide to Cloud Observability

Many businesses rely on cloud infrastructure to power their software solutions. The cloud today makes it easier than ever to create services and components, increasingly the complexity of software. With more and often smaller processes, cloud-native architectures have driven the need for better insights into our software—a way to look into how these processes fit together.

There Is Only One Key Difference Between Observability 1.0 and 2.0

We’ve been talking about observability 2.0 a lot lately; what it means for telemetry and instrumentation, its practices and sociotechnical implications, and the dramatically different shape of its cost model. With all of these details swimming about, I’m afraid we’re already starting to lose sight of what matters.

Tracing the Line: Understanding Logs vs. Traces

In the software space, we spend a lot of time defining the terminology that describes our roles, implementations, and ways of working. These terms help us share fundamental concepts that improve our software and let us better manage our software solutions. To optimize your software solutions and help you implement system observability, this blog post will share the key differences between logs vs traces.

Against Incident Severities and in Favor of Incident Types

About a year ago, Honeycomb kicked off an internal experiment to structure how we do incident response. We looked at the usual severity-based approach (usually using a SEV scale), but decided to adopt an approach based on types, aiming to better play the role of quick definitions for multiple departments put together. This post is a short report on our experience doing it.

Relational Fields: Query Even More Relationships in Your Traces

Earlier this year, we introduced relational fields. Relational fields enable you to query spans based on their relationship to one other within a trace, rather than only in isolation. We’ve now expanded this feature and introduced four new prefixes: child., none., any2., and any3.. Previously, you could use root., parent., and any. to query on the root span of your target span’s trace, the parent span of your target span, and any other span in the same trace as your target span.

Driving Multi-Region Observability Excellence at Lansweeper

Since its inception in 2004, Lansweeper has been at the forefront of helping businesses understand, manage, and protect their IT devices and networks through a powerful IT asset management platform. As the platform grew from an on-premises solution to a cloud-based SaaS offering, Lansweeper expanded its reach to a global, multi-region customer base.

Tame Your Telemetry: Introducing the Honeycomb Telemetry Pipeline

Observability means you know what’s happening in your software systems, because they tell you. They tell you with telemetry: data emitted just for the people developing and operating the software. You already have telemetry–every log is a data point about something that happened. Structured logs or trace spans are even better, containing many pieces of data correlated in the same record. But you want to start from what you have, then improve it as you improve the software.

Determining a CoPE's Efficacy-and Everything After

As discussed in the first article in this series, a Center of Production Excellence (CoPE) is a more or less formal, provisional subsystem within an organization. Its purpose is to act from within to change that organization so that it’s more capable of achieving production excellence. The series has, to date, focused mainly on how best to construct such a subsystem and what activities it should pursue.

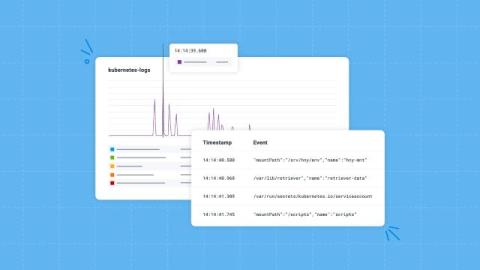
Debugging Kubernetes Autoscaling with Honeycomb Log Analytics

Let’s be real, we’ve never been huge fans of conventional unstructured logs at Honeycomb. From the very start, we’ve emitted from our own codestructured wide events and distributed traces with well-formed schemas. Fortunately (because it avoids reinventing the wheel) and unfortunately (because it doesn’t adhere to our standards for observability) for us, not all the software we run is written by us.