Operations | Monitoring | ITSM | DevOps | Cloud

Latest Posts

The Magic of Metrics-and How It Can Burn You

As product developers, our responsibility continues beyond shipping code. To keep our software running, we need to notice whether it’s working in production. To make our product smoother and more reliable, we need to understand how it’s working in production. We can do this by making the software tell us what we need to know. How can we notice when the software is running smoothly? Make it tell us!

How Time Series Databases Work-and Where They Don't

In my previous post, we explored why Honeycomb is implemented as a distributed column store. Just as interesting to consider, though, is why Honeycomb is not implemented in other ways. So in this post, we’re going to dive into the topic of time series databases (TSDBs) and why Honeycomb couldn’t be limited to a TSDB implementation. If you’ve used a traditional metrics dashboard, you’ve used a time series database.

Honeycomb Differentiators Series: SLOs That Tell the Whole Story

In the recent past, most engineering teams had a vague notion of what Service Level Agreements (SLAs) and Service Level Objectives (SLOs) were—mainly things that their more business-focused colleagues talked about at length during contract negotiations. The success or failure of SLAs were tallied via magic calculations (what is “available” anyway?!) at the end of the month or quarter, and adjustments were made in the form of credits or celebrations in the break room.

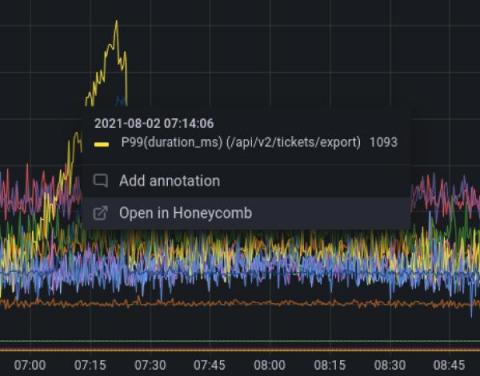
Announcing General Availability of the Honeycomb Query Data API

The Query Data API is a Honeycomb Enterprise feature. With a Honeycomb Enterprise account, you can use this API today. Head over to our API docs to learn how to get access to your data. If you aren’t yet a Honeycomb Enterprise user, try it out by requesting an Enterprise Trial. Starting today, Honeycomb Enterprise customers can use the Honeycomb Query Data API to programmatically run queries and retrieve their results, and pull query results into any data visualization tool of their choice.

The Blog Is Dead; Long Live the Blog

Ever since the very beginning, Honeycomb has poured a lot of heart and soul into our blog. We take pride in knowing it isn’t just your typical stream of feature updates and marketing promotions, but rather real, meaty pieces of technical depth, practical how-to guides, highly detailed retrospectives, and techno-philosophical pieces. One of my favorite things is when people who aren’t customers tell me how much they love our blog.

Understanding Lambda Sleep Cycles With CONCURRENCY

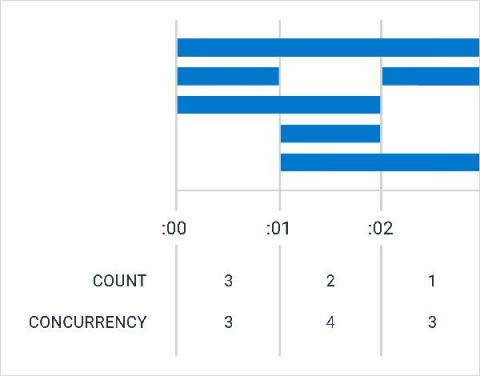
It started with a simple question: Why did one query take 10 seconds, while another almost identical query took 5? At Honeycomb, we use AWS Lambda to accelerate our query processing. It mostly works well, but it can be hard to understand and led us to wonder: What was really going on inside this box called Lambda? These questions kicked off the development of CONCURRENCY, a new aggregate in the Query Builder that lets us look at how many spans are active at once.

Observability: The 5-Year Retrospective

Two years ago, I wrote a long retrospective of observability for its third anniversary. It includes a history of instrumentation and telemetry, a detailed explanation of the technical spec, and why the whole “three pillars” thing is nonsense. At the time, it’s what was needed to steer conversations away from silly rabbit holes about data types and back to what matters: how we understand our systems.

How Refinery Helps With Sampling Complex Event Data

Sampling is the practice of extracting a subset of data from a dataset to make conclusions about that larger dataset. It’s far from a perfect solution, but when it’s implemented with Refinery, Honeycomb’s trace-aware sampling proxy, sampling can help you manage very high volumes of complex event data.

Metrics now generally available in Honeycomb

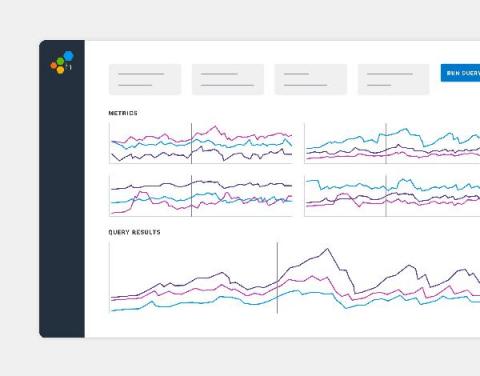
Starting today, Honeycomb Metrics is now generally available to all Enterprise customers. You’ve adopted our event-based observability practices, in part to overcome the debugging roadblocks you hit when using custom metrics to identify application issues. But metrics do still provide value at the systems level. Now, you can easily see and use your metrics data alongside your event data in Honeycomb—all in one interface.

An Introduction to Distributed Tracing

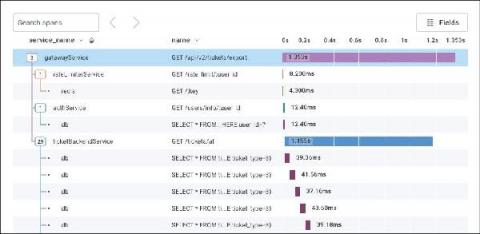
There’s no strict definition of a distributed system. But generally speaking, if you have reached a point where you’re running more than five interdependent services at once, that means you’re running a distributed system. It also means you are more than likely experiencing difficulties when troubleshooting using traditional debugging tools. Unfortunately, pulling up multiple tools, each built for a monolithic world, doesn’t help pinpoint the problem.