Operations | Monitoring | ITSM | DevOps | Cloud

Latest Posts

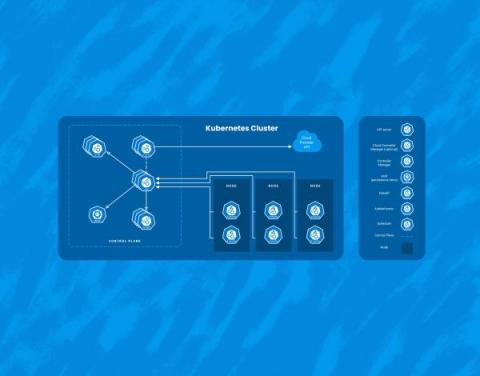
How Honeycomb Monitors Kubernetes

While Kubernetes comes with a number of benefits, it’s yet another piece of infrastructure that needs to be managed. Here, I’ll talk about three interesting ways that Honeycomb uses Honeycomb to get insight into our Kubernetes clusters. It’s worth calling out that we at Honeycomb use Amazon EKS to manage the control plane of our cluster, so this document will focus on monitoring Kubernetes as a consumer of a managed service.

How FireHydrant Implemented Honeycomb to Streamline Their Migration to Kubernetes

Kubernetes is the gold standard for container orchestration at scale. While massive global companies like Google, Spotify, and Pinterest rely on Kubernetes to run their software in production, so do many small but mighty developer teams. (Full disclosure: Honeycomb joined the Kubernetes brigade last year, when we migrated some of our services.)

Collecting Kubernetes Data Using OpenTelemetry

Running a Kubernetes cluster isn’t easy. With all the benefits come complexities and unknowns. In order to truly understand your Kubernetes cluster and all the resources running inside, you need access to the treasure trove of telemetry that Kubernetes provides. With the right tools, you can get access to all the events, logs, and metrics of all the nodes, pods, containers, etc. running in your cluster. So which tool should you choose?

Customer-Centric Observability: Experiences, Not Just Metrics

Martin and Jess recently conversed with Todd Gardner of RequestMetrics as part of the O11ycast podcast. We don’t normally write blogs based on these conversations, but there were impactful comments in that episode that bear repeating. You can listen to the full conversation if you wish. Let’s get into it!

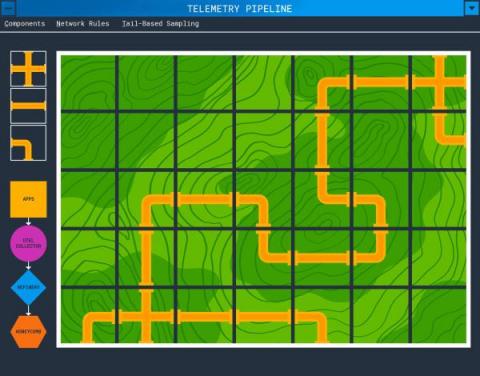
What Is a Telemetry Pipeline?

In a simple deployment, an application will emit spans, metrics, and logs which will be sent to api.honeycomb.io and show up in charts. This works for small projects and organizations that do not control outbound access from their servers. If your organization has more components, network rules, or requires tail-based sampling, you’ll need to create a telemetry pipeline.

5 Ways You Can Utilize Observability to Make Your Next Migration Easier

When people hear the word “migration,” they typically think about migrating from on-prem to the cloud. In reality, companies do migrations of varying types and sizes all the time. However, many teams delay making critical migrations or technical upgrades because they don’t have the proper tools and frameworks to de-risk the process.

How Traceloop Leverages Honeycomb and LLMs to Generate E2E Tests

At Traceloop, we’re solving the single thing engineers hate most: writing tests for their code. More specifically, writing tests for complex systems with lots of side effects, such as this imaginary one, which is still a lot simpler than most architectures I’ve seen: As you can see, when an API call is made to a service, there are a lot of things happening asynchronously in the backend; some are even conditional.

Observing the Future: The Power of Observability During Development

Just when you thought everything that could be shifted left has been shifted left, we’re sorry to say you’ve missed something: observability. Modern software development—where code is shipped fast and fixed quickly—simply can’t happen without building observability in before deployments happen. Teams need to see inside the code and CI/CD pipelines before anything ships, because finding problems early makes them easier to fix.

All the Hard Stuff Nobody Talks About when Building Products with LLMs

Earlier this month, we released the first version of our new natural language querying interface, Query Assistant. People are using it in all kinds of interesting ways! We’ll have a post that really dives into that soon. However, I want to talk about something else first. There’s a lot of hype around AI, and in particular, Large Language Models (LLMs).