Operations | Monitoring | ITSM | DevOps | Cloud

Latest Posts

'The Story of Grafana' documentary: From one developer's dream to 20 million users worldwide

On Dec. 5, 2013, Torkel Ödegaard made the first commit in GitHub for a personal project that would become Grafana. “It’s hard to believe it’s been 10 years since Torkel launched Grafana, growing from a small man with a big dream to becoming the most popular data visualization software in the world,” says Grafana Labs co-founder and CEO Raj Dutt. “The Story of Grafana” chronicles that meteoric journey.

New in Grafana k6: The latest OSS features in v0.49.0 and static IPs in Grafana Cloud k6

Grafana k6 v0.49.0 has been released, featuring a built-in web dashboard for real-time result visualization and tons of other improvements for Grafana k6 OSS. Here’s a quick overview of the latest features in Grafana k6 v0.49.0, as well as some other exciting updates related to Grafana Cloud k6 and the k6 ecosystem. To learn more about k6 and performance testing, check out the Grafana Labs blog.

Combining tracing and profiling for enhanced observability: Introducing Span Profiles

In today’s complex data landscape, continuous profiling has become essential for detailed insights into application resource usage. Grafana Labs is now advancing this field with the introduction of Span Profiles in Grafana 10.3. The Span Profiles feature represents a major shift in profiling methodology, enabling deeper analysis of both tracing and profiling data. Traditional continuous profiling provides a system-wide view over fixed intervals.

The Story of Grafana documentary: From dashboards to full-stack observability and beyond

Beehives in backyards. Rocket launches in California. Sourdough starters in mason jars. Shipping containers growing strawberries in Paris. “The stories you can tell from just a graph were really surprising,” says Grafana creator Torkel Ödegaard. But not impossible with Grafana, the ubiquitous open source visualization tool that is not just for monitoring applications.

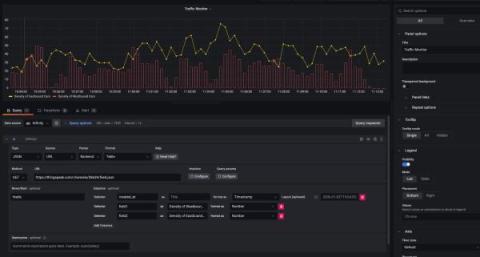
Infinity plugin for Grafana: Grafana Labs will now maintain the versatile data source plugin

Grafana was initially renowned for its ability to help users visualize time series data for platforms like Graphite and Elasticsearch. However, as the landscape evolved, demand surged for Grafana to embrace a wider array of data formats, particularly from third-party APIs.

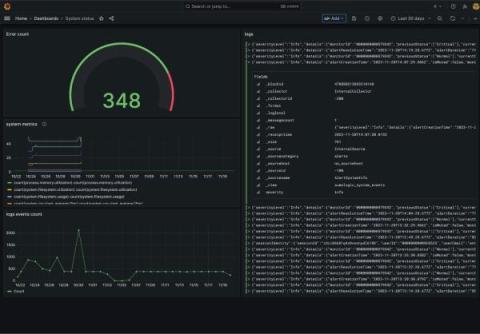
Visualize Sumo Logic metrics and logs with Grafana: Introducing the Sumo Logic Enterprise plugin

We are thrilled to announce the addition of a powerful new Enterprise plugin in the Grafana ecosystem: the Sumo Logic Enterprise data source plugin for Grafana. You can now easily connect Sumo Logic to your Grafana instance and correlate your log data with telemetry from all your data sources in one unified Grafana dashboard.

OpenTelemetry and Grafana Labs: What's new and what's next

A new year is a natural time to reflect on past achievements — and consider future aspirations. When I think about the observability space, specifically, in 2023, OpenTelemetry felt omnipresent. It was a hot topic at every industry event, with at least one dedicated talk at ObservabilityCON, Monitorama, PromCon, and KubeCon + CloudNativeCon, both NA and EU. A notable highlight from KubeCon was OpenTelemetry going GA, marking a significant milestone in the project’s development.

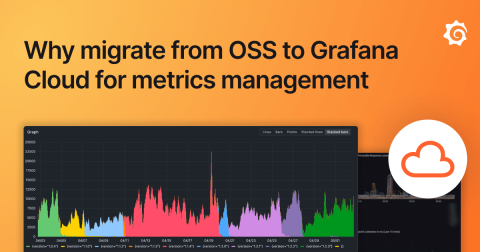
Why companies migrate from OSS to Grafana Cloud for metrics management

In 2022, we introduced Grafana Mimir, the most scalable and performant open source time series database in the world. And since its launch, we’ve been busy, increasing Mimir’s scale, making it easier to get started, and boosting query performance. But even with these advancements, we understand the challenges that can come with a self-hosted and self-managed OSS tool.

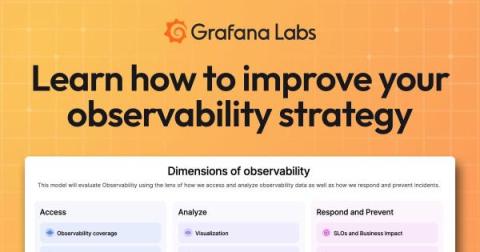
How to improve your observability strategy: Introducing the Observability Journey Maturity Model

While many segments of the IT market move quickly, the observability space seems to move at lightning speed. Fueled by open source innovation, observability toolsets and best practices constantly evolve. Sometimes, it can be tough to keep up — and even tougher to know where your own observability strategy stands. That’s the exact challenge we aim to address with our new Observability Journey Maturity Model.

Inside TeleTracking's journey to build a better observability platform with Grafana Cloud

Oren Lion, Director of Software Engineering, Productivity Engineering, and Tim Schruben, Vice President, Logistics Engineering, both work for TeleTracking, an integrated healthcare operations platform provider that is Expanding the Capacity to Care™ by helping health systems optimize access to care, streamline care delivery, and connect transitions of care.