Operations | Monitoring | ITSM | DevOps | Cloud

Latest Posts

Grafana Labs at KubeCon: Loki's March Toward GA

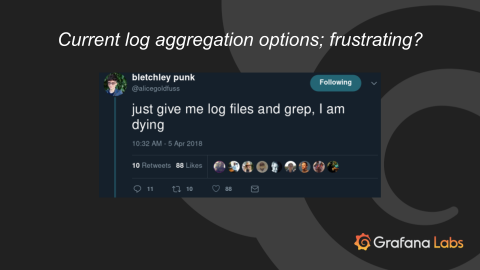
At KubeCon + CloudNativeCon EU this week, Grafana Labs VP Product Tom Wilkie gave a talk about Loki, the Prometheus-inspired service that optimizes search, aggregation, and exploration of logs natively in Grafana. In case you missed it, here’s a recap. Wilkie’s talk is an overview of how and why Grafana Labs built Loki and the features and architecture the team built in. Our policy is to develop projects in the open, so the design doc has been publicly accessible since development started.

Grafana Labs at KubeCon: The Latest on Cortex

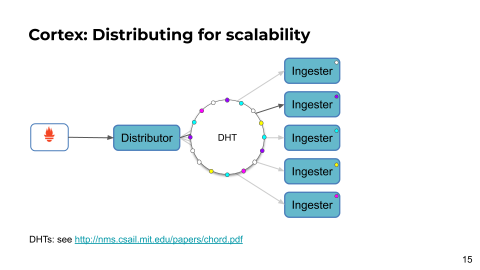
Grafana Labs has been running Cortex for more than a year to power Hosted Prometheus in Grafana Cloud. We’re super happy: It’s been incredibly stable and has recently gotten insanely fast. Here’s what you need to know about Cortex, what we’ve been doing to Cortex in the past year, and what we plan on doing in the coming months.

How Verizon Achieved Automation and Self-Service with Grafana

Can you monitor us now? That was the question Verizon started asking as the Fortune 500 company expanded its portfolio beyond communications services to include brands such as Yahoo! and Huffpost. “We’re not just grandma’s landline,” Sean Thomas, Verizon Systems Engineering Manager, told the audience at GrafanaCon in L.A. “We’re not just your mobile provider. We are a media company. We have 5G solutions. We’re building technology.

Worth a Look: Public Grafana Dashboards

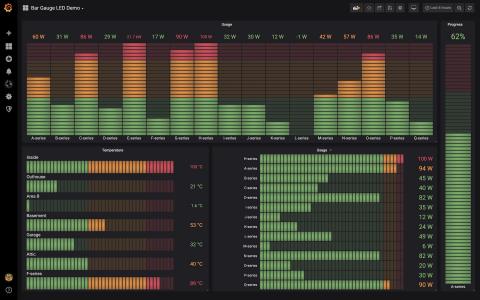
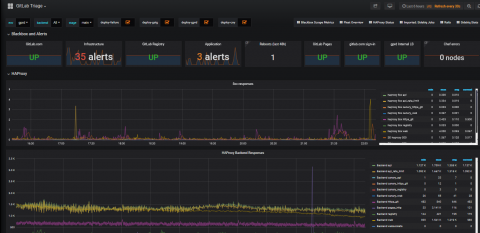
There are countless Grafana dashboards that will only ever be seen internally. But there are also a number of large organizations that have made their dashboards public for a variety of uses. These dashboards can be interesting to browse, giving you an insider’s peek into how real Grafana users set up their visualizations, with actual live data to boot. Perhaps some of them will inspire you to get to work on your own Grafana?

How to Streamline Infrastructure Monitoring with Sensu, InfluxDB, and Grafana

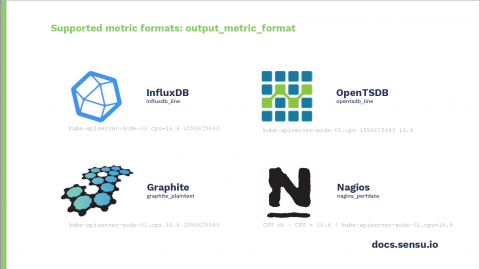
“To start, your monitoring stack should not cost you stacks,” Sensu Software Engineer Nikki Attea told the crowd at GrafanaCon L.A. “Avocado toast is really expensive. But the good news is your monitoring solution doesn’t have to be.” To prove it, Attea presented an easy developer-centric use case that leverages Sensu, a monitoring event pipeline which collects, processes, and roots different event types including discovery, availability, telemetry, and alerts.

Kubernetes Co-Creator Brendan Burns: Lessons Learned Monitoring Cloud Native Systems

“I’ve run a lot of systems in production, and a lot of what has gone into the Kubernetes project came out of scars that came from running web search in production and running API services,” Brendan Burns, the co-creator of Kubernetes, said at the top of his keynote at GrafanaCon L.A.

Ask Us Anything: Should I Run Prometheus in a Container?

At Grafana Labs, we field questions about best practices from customers all the time. One company recently asked whether it should run a containerized Prometheus environment rather than a VM-based one. We thought we’d share our answer here too. So: Should you run Prometheus in a container?

How Loki Correlates Metrics and Logs -- And Saves You Money

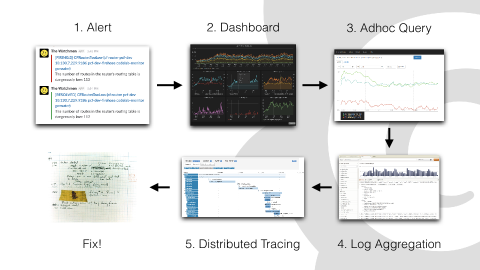
The situation is all too familiar: You get an alert. You look at your metrics and your dashboards to try and find out what the cause might be and when the incident actually started (instead of when the alert happened). Then you have to go somewhere else to look at logs because eventually you need more data.