Operations | Monitoring | ITSM | DevOps | Cloud

Latest Posts

How IoT -- and Grafana -- Are Enabling Electrification Across Rural Africa

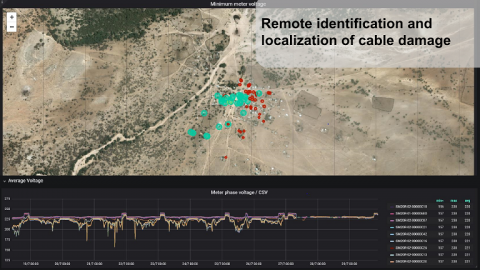
The Internet of Things has transformed people’s lives, enabling everything from “smart homes” to remote health monitoring. And now a startup called AMMP Technologies is using IoT – and Grafana – to help bring electricity to rural Africa. Hendrik Broering, COO and cofounder of AMMP, told the audience at GrafanaCon L.A. about a village in Tanzania called Changombe, with a population of about 2,000 and no access to electricity until 2017.

Grafana 5.4.4 and 6.1.6 released with important security fix

Today we are releasing Grafana 5.4.4 and 6.1.5. These patch releases include an important security fix for all Grafana installations between 5.4.0 and 6.1.6. Grafana installs between 6.0.0 and 6.1.4 are less vulnerable due to other security improvements. These versions are only vulnerable if the administrator has disabled default security settings.

How to Visualize Data that Really Matters to Business with Grafana and MySQL

So you have a Grafana dashboard that shows failures at 0.01% and that latency is down throughout the company. But rather than get a pat on the back, “your boss’s boss is saying cut the crap or stop the mumbo jumbo. What does it really mean for our business?” said Peter Zaitsev, CEO of Percona, which offers solutions such as support, management services, consultant training, and custom engineering for MySQL, MariaDB, MongoDB, Postgres and other open source databases.

The Trade Desk: Lessons We Learned Migrating from Homegrown Monitoring to Prometheus

The Trade Desk provides a self-service, cloud-based platform for buyers of online advertising. Since its founding in 2009, TTD has grown into a publicly traded company with more than 900 employees and a market cap of $8.89 billion. The company recently moved from an old monitoring system based on Nagios, Graphite, and a number of homegrown pieces of software, to something more standard, based on Prometheus.

How SevOne Is Live Streaming Grafana Data Sources

SevOne, a 14-year-old company in the network monitoring space, started using Grafana for self-monitoring last year because there weren’t many frontend engineers in the organization at the time. “We fell in love with it,” SevOne Tech Lead Sean Lafferty said during his GrafanaCon talk about how the company live streams Grafana data sources.

Everything You Need to Know About the OSS Licensing War, Part 3.

In Parts One and Two of this blog, we looked back at the ongoing open source licensing wars, focusing on the evolving situation between Elastic N.V. and AWS. In this final installment, we’ll offer some opinions on the situation, as well as share our own views on how we’re reacting at Grafana Labs.

How Bloomberg Tracks Hundreds of Billions of Data Points Daily with MetricTank and Grafana

Bloomberg is best known as a media company with its news destination site, its award-winning magazine Bloomberg Businessweek, and its daily 24-7 social media program, Tic Toc, on Twitter. But the main product for the 38-year-old company is actually Bloomberg Terminal, a software system that aggregates real-time market data and delivers financial news to more than 325,000 subscribers around the world.

Grafana Plugin Tutorial: Polystat Panel (Part 2)

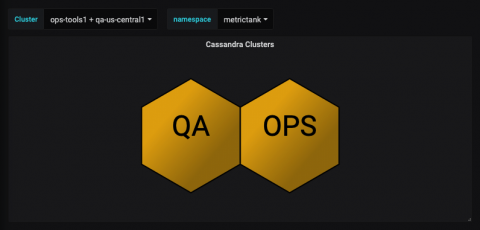
At the end of Part 1, the end result was a set of polygons that represented each Cassandra node in a Kubernetes statefulset. The cAdvisor-based metrics CPU/Memory/Disk utilization are scraped by Prometheus. This second tutorial will focus on a rollup of multiple Cassandra clusters running inside Kubernetes. We will end up with three dashboards tied together to provide an overview of our Cassandra clusters.

How We Designed Loki to Work Easily Both as Microservices and as Monoliths

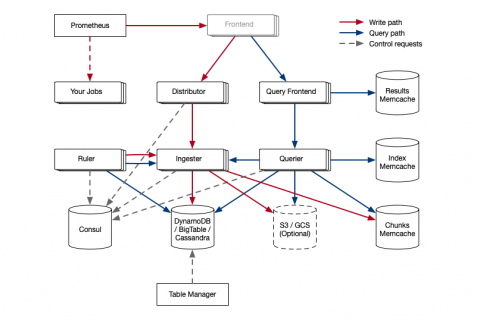
In recent years, monoliths have lost favor as microservices increased in popularity. Conventional wisdom says that microservices, and distributed systems in general, are hard to operate: There are often too many dependencies and tunables, multiple moving parts, and operational complexity.