Operations | Monitoring | ITSM | DevOps | Cloud

Latest Posts

Choosing the Right Observability Tools for Developers

This is the third and final blog post in a series about shifting Observability left. If you have not yet read the first two, you can find the first post here and the second post here. Observability is fundamental to modern software development, enabling developers to gain deep insights into their application’s behavior and performance.

Video analytics at the edge: How video processing benefits from edge computing

Computer vision: digital understanding of the physical world From face recognition to fire prevention, autonomous cars to medical diagnosis, the promise of video analytics has enticed technology innovators for years. Video analytics, the processing and analysing of visual data through machine learning and artificial intelligence, is perceived as a significant opportunity for edge computing.

Browser Profiling Learnings from Sentry.io

Since enabling browser profiling on our Sentry.io dashboard a month ago, we have collected over 2M profiles and learned a lot about how our users experience our dashboard. The profiles collected gave us insight into how our dashboard performs in production and surfaced some issues causing UI jank. In this post, we will look at an example of an issue we discovered using Profiling.

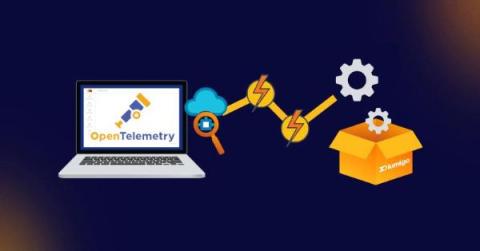
Building a Secure OpenTelemetry Collector

The OpenTelemetry Collector is a core part of telemetry pipelines, which makes it one of the parts of your infrastructure that must be as secure as possible. The general advice from the OpenTelemetry teams is to build a custom Collector executable instead of using the supplied ones when you’re using it in a production scenario. However, that isn’t an easy task, and that prompted me to build something.

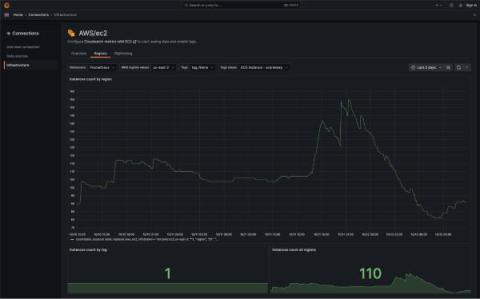
Monitor Amazon EC2: key metrics for instances, regions, and more in one view

Amazon EC2 was one of the first services available on AWS, helping propel the cloud platform into the mainstream of IT. And while EC2 instances come in a wide range of sizes and flavors to address all sorts of use cases, keeping tabs on those instances isn’t always easy. That’s why we’re excited to introduce our new EC2 monitoring solution in Grafana Cloud.

DX UIM 23.4 Sets a New Standard for Infrastructure Observability

DX Unified Infrastructure Management 23.4 (DX UIM 23.4) is now available. DX UIM 23.4 is the latest version of our cornerstone, full-stack infrastructure observability solution for hybrid cloud and traditional data center environments. DX UIM is a key component of AIOps by Broadcom, a suite of solutions that leverage best-of-breed domain monitoring tools and advanced analytics to deliver actionable insights and enable intelligent automation across the IT operations stack.

Effective strategies for managing cron jobs: Best practices and tools

Cron jobs are essential for automating repetitive tasks and streamlining website and application management. Properly managing cron jobs is crucial for maintaining system efficiency and minimizing risks. In this article, we will explore the significance of cron jobs in tech environments, delve into common challenges in their management, and introduce advanced monitoring solutions like WebGazer. We will also provide best practices to ensure efficient and secure cron job management.

Building a Custom Read-only Global Role with the Rancher Kubernetes API

In 2.8, Rancher added a new field to the GlobalRoles resource (inheritedClusterRoles), which allows users to grant permissions on all downstream clusters. With the addition of this field, it is now possible to create a custom global role that grants user-configurable permissions on all current and future downstream clusters. This post will outline how to create this role using the new Rancher Kubernetes API, which is currently the best-supported method to use this new feature.