Operations | Monitoring | ITSM | DevOps | Cloud

Latest Posts

AWS Costs: Surprise, Surprise? It Shouldn't Be!

A recent article by The Information: As AWS Use Soars, Companies Surprised by Cloud Bills was very interesting and worth a read. The authors examined the AWS spending patterns of five large companies to demonstrate that all were way over budget as it related to AWS spend. They reference Pinterest “spending roughly $190 million on AWS last year, $20 million more than it had initially expected... and Adobe’s bill rose 64%, while Capital One’s jumped 73%; Pinterest’s rose 41%...

Monitoring policy system in Pandora FMS. What they are like, what they are and where to find them

“Monitoring policy system”, “monitoring policy system”, “monitoring policy system”… As much as you repeat it, it still sounds boring, unappetizing and expensive. But you have to admit that an in-depth contact with the monitoring policy system, especially the system that concerns you, is also useful, convenient and practical after all. Therefore, to benefit you, we will start today with the policies in Pandora FMS.

How to Use Python Profilers: Learn the Basics

Serious software development calls for performance optimization. When you start optimizing application performance, you can’t escape looking at profilers. Whether monitoring production servers or tracking frequency and duration of method calls, profilers run the gamut. In this article, I’ll cover the basics of using a Python profiler, breaking down the key concepts, and introducing the various libraries and tools for each key concept in Python profiling.

The next chapter: announcing the EOL schedule for Sensu Core 1.x and Sensu Enterprise 3.x

In case you missed it, Sensu Go became generally available in December 2018, and commercial support for Sensu Go became generally available just last month. With these major milestones now in our rearview mirror, it's time to help our customers reach their own milestones of migrating from Sensu to Sensu Go.

We Tested Google Analytics vs Anodot - See Which Anomaly Detection Solution Won

A couple of months ago we released the all-new Anodot.com. Following the release, I explored our Google Analytics account to see what had happened post-launch. I have always been ambivalent about Google Analytics. On the one hand, the service has helped shape web analytics as we know it today and is used by nearly every website. Not to mention it’s free and rather easy to consume. On the other hand, GA is never a slam dunk.

Endpoint Security Analytics with Sumo Logic and Carbon Black

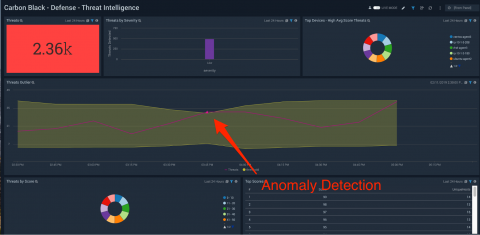
As the threat landscape continues to expand, having end-to-end visibility across your modern application stack and cloud infrastructures is crucial. Customers cannot afford to have blind spots in their environment and that includes data being ingested from third-party tools.

Caching in: performance engineering in Jira Cloud

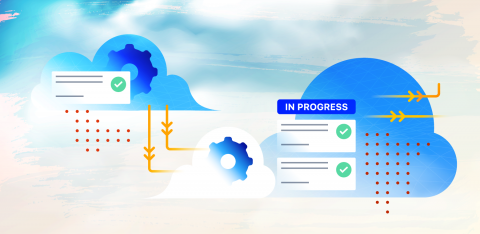
Go behind the scenes with the Jira team and see how we performance-engineered our way to a zero-affinity cloud architecture that runs at enterprise scale. Performance engineering is a big deal when you’re serving millions of users from every corner of the globe. We previously wrote about a large engineering transformation program for Jira & Confluence, which we codenamed Vertigo – read more about the overall program here.

5 Benefits to Run Elastic Stack in the Cloud

Elasticsearch, Logstash, and Kibana — the trio better known as Elastic Stack (or ELK, if you prefer a term that is now going out of style), make up a powerful set of tools for searching and analyzing data. Their power derives not just from their technical features, but also the fact that Elastic Stack is an open source platform that anyone can download and set up anywhere.