Operations | Monitoring | ITSM | DevOps | Cloud

Latest Posts

Guide: How to use LogDNA Views to Manage Logs Effectively

Views may seem straightforward at first, but they hide a lot of power. On a very basic level, a view is a shortcut to a specific search query or filter. You can use views to display only a subset of logs, create alerts and graphs, export specific events, and even embed your log event feed on another website. In this post, we’ll present several tips and tricks for making the most out of views.

How to measure every API call in your Go app (in fewer than 30 lines of code)

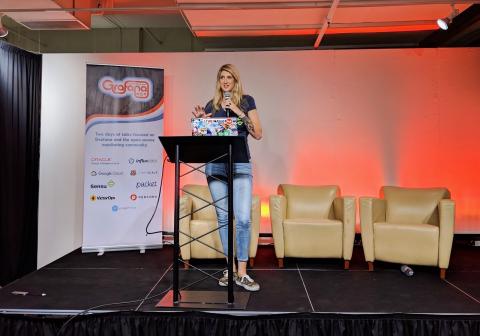
I recently gave a talk at GrafanaCon LA, which was heavily inspired by my blog post on check output metric extraction. During the talk, I dove into a popular monitoring use case with Sensu, InfluxDB, and Grafana — let’s call it the SIG stack . While I got to share some awesome features in Sensu that ultimately allow users to collect, store, and visualize their metrics, the conference was about Grafana, and folks wanted to see dashboards!

Injection Attacks: Protecting Your Serverless Functions

While trying to verify the claims made on a somewhat facile rundown of serverless security threats, I ran across Jeremy Daly’s excellent writeup of a single vulnerability type in serverless, itself inspired by a fantastic talk from Ory Segal on vulnerabilities in serverless apps. At first I wanted to describe how injection attacks can happen. But the fact is, the two resources I just shared serve as amazing documentation; Ory found examples of these vulnerabilities in active GitHub repos!

Sysdig and Falco now powered by eBPF.

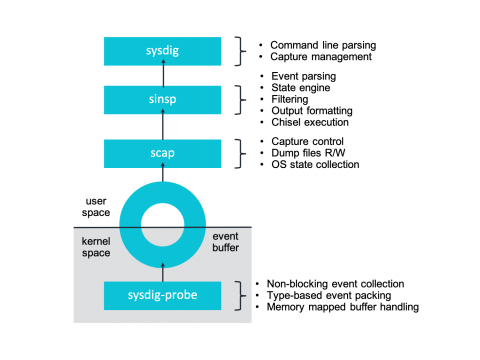
At Sysdig we’ve recently undergone a pretty interesting shift in our core instrumentation technology, adapting our agent to take advantage of eBPF – a core part of the Linux kernel. Sysdig now supports eBPF as an alternative to our Sysdig kernel module-based architecture. Today we are excited to share more details about our integration and the inner workings of eBPF. To celebrate this exciting technology we’re publishing a series of articles entirely dedicated to eBPF.

Introducing container observability with eBPF and Sysdig.

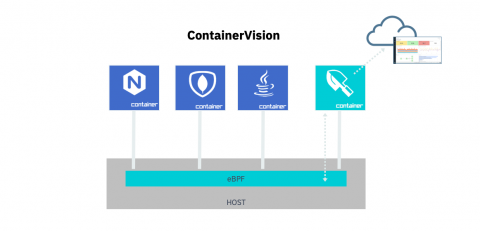
Today we’ve announced that we’ve officially added eBPF instrumentation to extend container observability with Sysdig monitoring, security and forensics solutions. eBPF – extended Berkeley Packet Filter – is a Linux-native in-kernel virtual machine that enables secure, low-overhead tracing for application performance and event observability and analysis.

Monitoring Azure Activity Logs with Logz.io

In a previous post, we introduced a new integration with Microsoft Azure that makes it easy to ship Azure logs and metrics into Logz.io using a ready-made deployment template. Once in Logz.io, this data can be analyzed using the advanced analytics tools Logz.io has to offer — you can query the data, create visualizations and dashboards, and create alerts to get notified when something out of the ordinary occurs.

Browser vulnerabilities: Securing against the inevitable

Web browsers have revolutionized the way we use the internet. They’ve escalated employee productivity, but have also opened up organizations to a plethora of security loopholes. Browsers are the easiest point of entry for hackers to exploit a system because they contain vulnerable components like plug-ins and cookies.

Braving the Arena of High Cardinality

The DevOps era has turned traditional monitoring on its head with diverse, ephemeral data streaming from containers, microservices, and serverless functions as well as directly from the applications these new technologies enable. With efforts to efficiently utilize every drop of network, storage and compute, modern applications have created new challenges that render legacy IT operations management (ITOM) tools ineffective.