Operations | Monitoring | ITSM | DevOps | Cloud

Latest Posts

How Apica Flow Economizes Your Splunk Costs

In the current high-volume business environments, the demand for accurate and available data is higher than ever. Traditional data management solutions often fall short, escalating costs and operational challenges. Gartner reports that by 2027, at least 40% of organizations will deploy advanced data storage management solutions, a significant increase from just 15% in early 2023. This shift underscores the urgent need for efficient data management tools.

Fast Track to Digital Resilience: Splunk Platform Innovation

It’s critical that you are in the driver seat of your Splunk environment with choice and flexibility, and we have spent the last year extending the capabilities of Splunk’s unified security and observability platform to do so. We have continued to grow and innovate to ensure that you and your team have all the tools you need to have a secure, cost-efficient, and effective environment.

New Splunk Innovations Help Build a Leading Observability Practice for the Whole Enterprise

So much goodness is coming your way! Find out all about the latest and greatest from Splunk Observability that helps you keep your entire stack up and running, no matter where it’s deployed or who’s troubleshooting.

Essential Steps to Troubleshoot A Network

Network troubleshooting might seem intimidating, but fear not! We'll equip you with the essential steps to diagnose and resolve common network problems, empowering you to get your tech back on track and reclaim your digital peace of mind. Whether you're a seasoned IT professional or a home user facing a frustrating connection issue, this guide will provide you with the knowledge and tools you need to become a network troubleshooting pro!

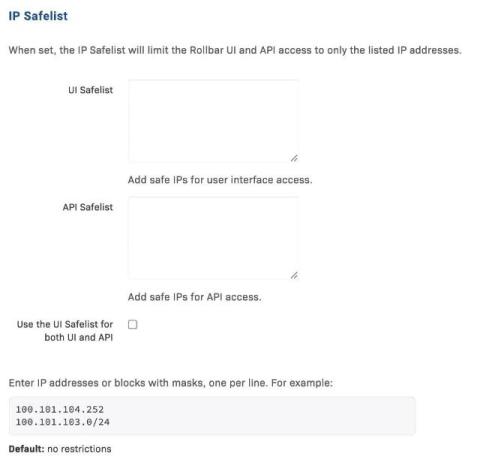
Introducing IP Safelist for our API access

At Rollbar, we understand that security is not just a feature but a cornerstone of modern enterprise operations. As part of our ongoing commitment to providing robust security solutions, we are excited to announce the expansion of our security controls by introducing IP Safelist for our API access. This new feature extends the advanced security options available in our Enterprise packages.

How to Monitor Multiple Status Pages Effectively in 2024

In today’s digital landscape, relying on multiple services is inevitable, as is the occurrence of outages. According to Trilio, over 80% of organizations have experienced an outage in the past three years. Even if your services avoid incidents, scheduled maintenance downtime is unavoidable. Given the heavy dependence on third-party services, monitoring the status of cloud services is crucial.

What is hybrid observability? Transform ITOps with AI insights

In today’s rapidly evolving technological landscape, IT teams grapple with the complexities of managing hybrid environments, where on-premises infrastructure coexists with cloud-based services. A report by 451 Research highlights the prevalence of this challenge, revealing that over 60% of organizations operate in hybrid environments. Yet, many struggle to manage the intricacies of this architecture effectively.

Cloud Migration: Security Shines a Light on Operations' Dark Networks

Dark networks have provided a measure of security to supply-chain operations for a couple of decades. These networks are closed to the outside world, only accessible via the connections between enterprise systems – think warehouse management, enterprise resource planning, etc. – and the rugged mobile devices carried by workers within these environments. And, everything is managed by on-premises device management products that never connect beyond the business’s facilities.

Grafana update: Service account tokens are replacing API keys

Enhancing security and providing flexible access control has always been part of our core mission at Grafana. In line with those efforts, we made service accounts generally available in Grafana 9.1. Service accounts are essentially machines simulating Grafana users, and they are used to run automated workloads — for example, counting the number of data sources in Grafana every day or provisioning alerts using Terraform.