Operations | Monitoring | ITSM | DevOps | Cloud

Latest News

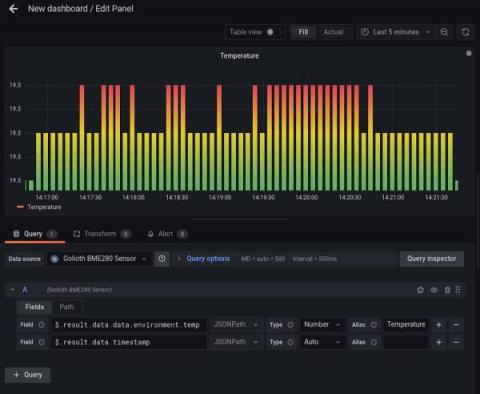
How to use WebSockets to visualize real-time IoT data in Grafana

Mike Szczys is a Developer Relations Engineer at Golioth. His deep love of microcontrollers began in the early 2000s, growing from the desire to make more of the BEAM robotics he was building. When he’s not reading data sheets, he’s busy as an orchestra musician in Madison, Wisconsin. At Golioth, a commercial IoT development platform, we love using the power of Grafana to easily visualize data from IoT installations where tens, hundreds, or even thousands of devices are reporting back.

What's next for the Internet of Things?

IoT devices seem to be ubiquitous, but the truth is we’re not nearly there yet. In fact, IoT Analytics continues to predict steady growth as the future for IoT for years to come, with more than 27 billion devices online by 2025. They’re not alone in their bullish IoT predictions either. MarketsAndMarkets projects the global IoT market will more than double from 2021 to 2026, growing from just over $300 billion to over $650 billion.

Where Will Process Historians Fit in the Modern Industrial Technology Stack?

When Rolls Royce Power Systems recently needed to improve its operational efficiency within its manufacturing plants, it didn’t expand its use of a legacy process historian or purchase historian connectors to export data to their business intelligence systems. Instead, it decided to go with a modern time series database, InfluxDB. Graphite Energy, another customer we featured in our recent IIoT announcement, also chose InfluxDB over the legacy process historian vendors. Why?

InfluxDB as an IoT Edge Historian: A Crawl/Walk/Run Approach

The question of how to get data into a database is one of the most fundamental aspects of data processing that developers face. Data collection can be challenging enough when you’re dealing with local devices. Adding data from edge devices presents a whole new set of challenges. Yet the exponential increase in IoT edge devices means that companies need proven and reliable ways to collect data from them.

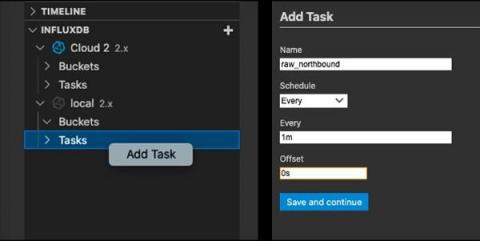
Using InfluxDB as an IoT Edge Historian

InfluxDB is increasingly being used in IoT solutions to store data from connected devices. Now it can also be used on IoT edge gateways as a data historian to analyze, visualize and eventually transmit aggregated IoT data up to a centralized server. In this article we’re going to look at three simple ways you can connect an instance of InfluxDB on your IoT Edge device to another instance of InfluxDB in the cloud.

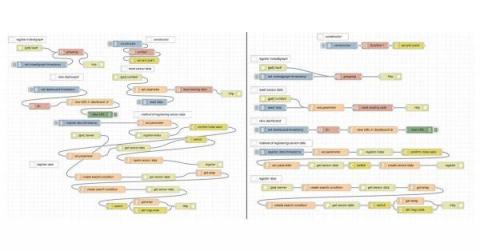
Taking care of your loved ones with Grafana and other open source solutions

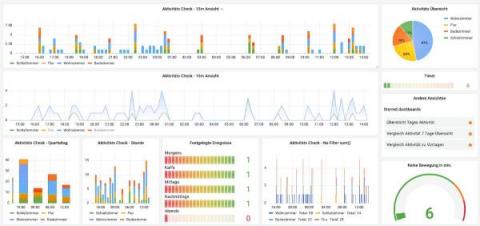
Amon Reich is the founder of SmartLiving.Rocks based out of Schweinfurt, Germany, an IoT solutions provider for smart homes and small businesses. Amon maintains the open source SeniorenSmarthome project, which enables Ambient Assisted Living through Grafana dashboards and other open source technologies. I’ve been working in the field of smart technology for over 10 years.

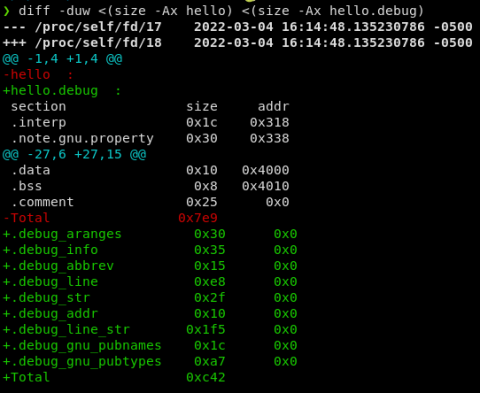
Running Tracealyzer 4 on Linux hosts

To run Tracealyzer 4 on Linux, the first thing you will need to install is Mono. For most distributions there’s a package called “mono-complete”, though some distributions and package systems may instead use simply “mono”. There may be additional requirements, in particular for Debian/Ubuntu and Fedora based systems. See below for distribution specific instructions. Mono version 5.14 (or newer) is required for Tracealyzer.