Operations | Monitoring | ITSM | DevOps | Cloud

Latest News

Make time-series exploration easier with the PostgreSQL/TimescaleDB query editor

Grafana v5.3 comes with a new visual query editor for the PostgreSQL datasource. The query editor makes it easier for users to explore time-series data by improving the discoverability of data stored in PostgreSQL. Users can use drop-down menus to formulate their queries with valid selections and macros to express time-series specific functionalities, all without a deep knowledge of the database schema or the SQL language.

How to install a High Availability Database Cluster with Pandora FMS

Pandora FMS relies on a MySQL database for configuration and data storage. A database failure can temporarily bring your monitoring solution to a halt. The Pandora FMS high availability database cluster allows you to easily deploy a fault-tolerant, robust architecture.

Tackling the top four challenges of Azure SQL Database monitoring

With large enterprises increasing their focus on public cloud providers, Microsoft Azure continues to have a strong foothold in the hybrid cloud industry. Azure adoption increased a whopping 11 percent last year from 34 to 45 percent, reveals the latest survey by RightScale.

Improved Database Support Enhances Data Visibility and Helps Resolve Problems Faster

Total visibility is crucial to monitoring the database environments that support your most critical applications. That’s why AppDynamics recently released a number of updates to our Database Visibility functionality. Not only do we now support monitoring Couchbase, but we also added snapshot correlation, support for custom cluster configuration, and enhancements to our ability to collect and track custom database metrics.

A Primer on Building a Monitoring Strategy for Amazon RDS

In a previous blog post, we talked about Amazon Relational Database Service (RDS). RDS is one of the most popular cloud-based database services today and extensively used by Amazon Web Services (AWS) customers for its ease of use, cost-effectiveness and simple administration.

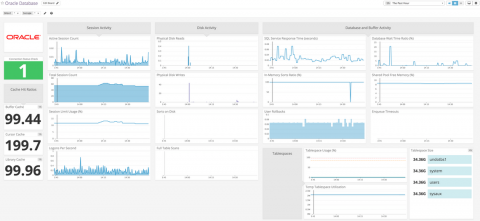
Monitor Oracle Database with Datadog

Oracle Database has long been a mainstay of the business world. Companies use it to handle data sets backing a wide variety of complex applications, including data warehouses or OLTP systems. Oracle Database includes enterprise-friendly features that emphasize scalability, advanced partitioning, and optimized availability of data across a large, potentially disparate infrastructure, as well as real-time backup and recovery tools.

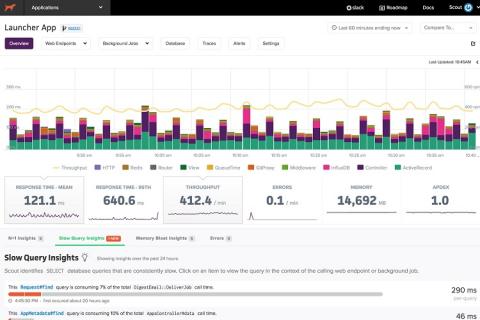
Finding slow ActiveRecord queries with Scout

Once your Rails app begins seeing consistent traffic, you're bound to have slow SQL queries. While PostgreSQL and MySQL can log slow queries, it's difficult to gleam actionable information from this raw stream. The slow query logs lack application context: where's the LOC generating the query? Is this slow all of the time, or just some of the time? Which controller-action or background job is the caller? Enter Scout.

Finding and fixing N+1 queries in Django apps

The Django ORM makes it easy to fetch data, but there's a downside: it's easy to write inefficient queries as the number of records in your database grows. One area where the ease of writing queries can bite is you is with N+1 queries. Expensive N+1 queries go undiscovered in small development databases. Finding expensive N+1 queries is an area where Scout is particularly helpful.