Operations | Monitoring | ITSM | DevOps | Cloud

Latest News

OpenTelemetry in Production: A Primer

At observIQ, we’re big believers and contributors to the OpenTelemetry project. In 2023, we saw project awareness reach an all-time high as we attended tradeshows like KubeCon and Monitorama. The project’s benefits of flexibility, performance, and vendor agnosticism have been making their rounds; we’ve seen a groundswell of customer interest.

What is the OpenTelemetry Transform Language (OTTL)?

The OpenTelemetry Transformation Language, or OTTL for short, offers a powerful way to manipulate telemetry data within the OpenTelemetry Collector. It can be leveraged in conjunction with OpenTelemetry processors (such as filter, routing, and transform), core components of the OpenTelemetry Collector. It caters to a range of tasks from simple alterations to complex changes.

Comparing OpenTelemetry and Jaeger | Key Features

Jaeger and OpenTelemetry are essential technologies that greatly improve the observability of software applications. OpenTelemetry is a vendor-neutral platform that makes it easier to create and collect telemetry data, including logs, traces, and metrics. Its extensive backend integration adaptabilities allow it to fit into a wide range of infrastructures. However, Jaeger is an expert in distributed tracing within microservice environments.

How to instrument your Python application using OpenTelemetry

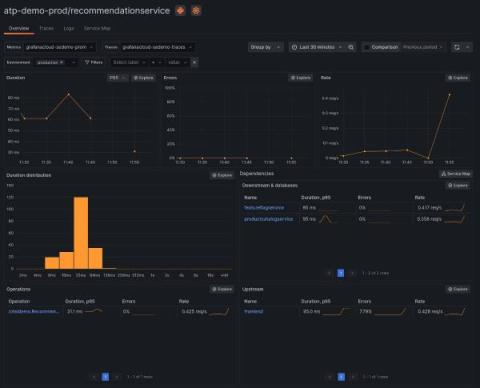
If you want to see if OpenTelemetry helps you become a better Python developer — or if you just want to know how to add OpenTelemetry to your Python service — you’ve come to the right place. In this blog, we’ll show you how to instrument your Python application using OpenTelemetry and how to visualize your OpenTelemetry data using Application Observability in Grafana Cloud. We’ll walk you through the following steps.

OpenTelemetry: 3 questions to ask before choosing an observability solution

As OpenTelemetry rises in popularity, more organizations are implementing, or planning to implement, the open source project to monitor their applications — and, meanwhile, more vendors are offering OpenTelemetry support. In fact, a quick Google search for “OpenTelemetry support” shows results ranging from legacy APM vendors to newer, cloud native solutions like Grafana Cloud.

OTel Explainer: Simplifying Observability in Modern IT Environments

In today's rapidly evolving landscape of distributed systems and microservices, understanding how applications behave in production environments has become increasingly complex. Traditional monitoring tools often fall short when it comes to providing comprehensive insights into the performance and behavior of these modern architectures.

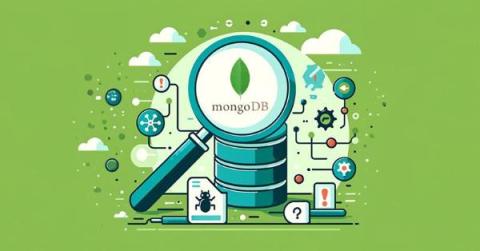
Debugging and Decoding MongoDB with OpenTelemetry

MongoDB’s flexibility and document-oriented nature have always stood out to me as its most compelling features, setting it apart from the strict schema constraints of traditional relational databases. This adaptability is a boon for application development, allowing for more dynamic data interactions that mirror real-world information complexities and freeing table schemas’ constraints.

Get Swept Off Your Feet by Cribl Stream 4.5: Converting Dimensional Metrics to the OpenTelemetry Protocol Format with the OTLP Metrics Function

In the dynamic world of observability and analytics, everyone’s looking for smarter, more efficient, and interoperable ways to handle their data. That’s where Cribl steps in, bringing you an exciting update to our product lineup. We’re thrilled to introduce the OTLP Metrics Function to Cribl Stream 4.5! This Function converts metrics into the OpenTelemetry Protocol (OTLP) format with ease!

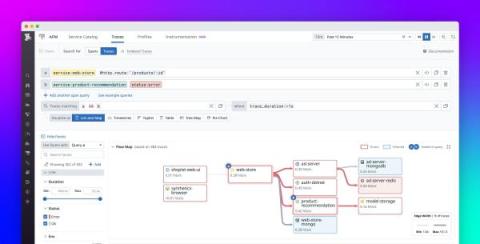
Analyze the root causes and business impact of production issues with Trace Queries

Tracing provides indispensable insights into the state and performance of distributed applications, but it can often be difficult to determine the root cause or ultimate business impact of issues indicated by traces. Translating visibility of individual microservices into broader performance insights often requires drawing complex correlations between spans. This can be a laborious process, which can complicate everything from troubleshooting and triage to tracking KPIs and managing costs.