Operations | Monitoring | ITSM | DevOps | Cloud
Latest News
Infinite Retention with OpenTelemetry and Honeycomb
The needs of observability workloads can sometimes be orthogonal to the needs of compliance workloads. Honeycomb is designed for software developers to quickly fix problems in production, where reducing 100% data completeness to 99.99% is acceptable to receive immediate answers. Compliance and audit workloads require 100% data completeness over much longer (or "infinite") time spans, and are content to give up query performance in return.
OpenTelemetry Webinars - Gathering data with the OpenTelemetry Collector
Diving in to OpenTelemetry data with our new Trace and Logs Explorer
Free Jaeger Alternatives [comparison 2023]
Measuring the time between spans in an OpenTelemetry trace with a Clickhouse query
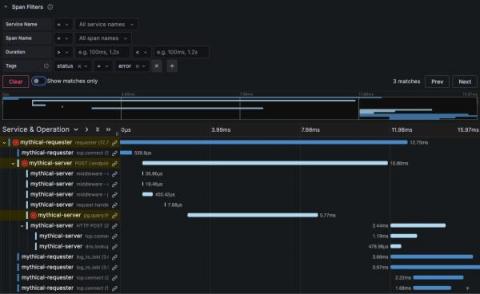
What's new in distributed trace visualization in Grafana
At Grafana Labs, we are constantly improving our feature set, and tracing is no different. Traces are often overshadowed by logs and metrics, but they’re a pillar of observability for a reason. Used correctly, organizations that can quickly and successfully follow a chain of events through a system gain a more holistic view of their systems and are better equipped to find and fix issues faster.
Traces vs Spans
In the context of application performance monitoring (APM) and observability, traces and spans are fundamental concepts that help users to track and understand the flow of requests and operations within a system. They are essential in assisting users to identify bottlenecks, troubleshoot issues, and optimize application performance.
7 OpenTelemetry Metrics to Track for Better Visibility
In today’s rapidly evolving software landscape, ensuring observability is crucial for building robust and reliable applications. One of the critical components of observability is metrics, which provide valuable insights into the performance and behavior of our systems. OpenTelemetry, an open-source observability framework, offers a standardized approach to capturing, exporting, and analyzing metrics. This blog post explores seven OpenTelemetry metrics for tracking better visibility.
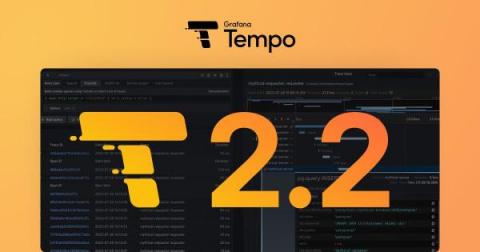
Grafana Tempo 2.2 release: TraceQL structural operators are here!
Get excited about Grafana Tempo 2.2! Not only is this release on time, but it is also chock full of TraceQL features and performance improvements. I was honestly a little shocked by how much we have accomplished in the last three months when summarizing the changelog.


