Operations | Monitoring | ITSM | DevOps | Cloud

Latest News

Tuning Jaeger's performance

Jaeger was built from day 1 to be able to ingest huge amounts of data in a resilient way. To better utilize resources that might cause delays, such as storage or network communications, Jaeger buffers and batches data. When more spans are generated than Jaeger is able to safely process, spans might get dropped. However, the defaults might not fit all scenarios: for instance, agents running as a sidecar might have more memory constraints than agents running as a daemon in bare metal.

BubbleUp Meets Tracing (and Other Odd-shaped Data)

A few weeks ago, BubbleUp came out of Beta. We’ve been getting fantastic user feedback on how BubbleUp helps users speed through the Core Analysis Loop and lets people find things they never could have found before. We’ve also been learning more about how BubbleUp works with Tracing, which unearthed some difficult issues. Today, we’re taking those head on.

PHP monitoring with Datadog APM and distributed tracing

Since its release in 1995, PHP has been one of the most popular server-side languages for building web applications. It supports a wide range of web servers, databases, and operating systems. PHP developers use popular frameworks like Laravel, Symfony, and Zend to deploy and manage sites that serve high volumes of traffic. To help you monitor PHP performance, identify bottlenecks, and optimize your users’ experience, we’re pleased to announce APM & distributed tracing for PHP.

Performance monitoring with OpenTracing, OpenCensus, and OpenMetrics

If you are familiar with instrumenting applications, you may have heard of OpenMetrics, OpenTracing, and OpenCensus. These projects aim to create standards for application performance monitoring and collecting metric data. Although the projects do overlap in terms of their goals, they each take a different approach to observability and instrumentation.

Distributed Transaction Tracing: How to Detect Application Performance Issues at The Code Level

Forty-three percent of application performance problems occur because of an issue in the application code, according to a DZone study. Code-level issues include bugs in the code constructs, such as long waits, poor iterations, inefficient code algorithms, unhandled exceptions, bad choice of data structures, etc. Developers and application owners need code-level insight, so they can pinpoint issues in the code and fix them before users notice.

Help! Something is wrong with my Jaeger installation!

Jaeger is composed of different components, each potentially running in its own host. It might be the case that one of these moving parts isn’t working properly, causing spans to not be processed and stored. When something goes wrong, make sure to check the items listed here.

Datadog APM gains 3 superpowers: Trace Search, Service Map & Watchdog

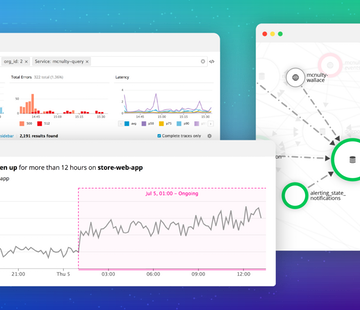
Since we made Datadog APM generally available last year, we have continually added new features and support for new languages and frameworks to ensure that you can monitor every aspect of application performance. Datadog APM helps companies such as Airbnb, Square, and Zendesk to optimize application performance and deliver top-notch customer experiences.