Operations | Monitoring | ITSM | DevOps | Cloud

Latest News

See What It's Like to Have It All (In One Place)

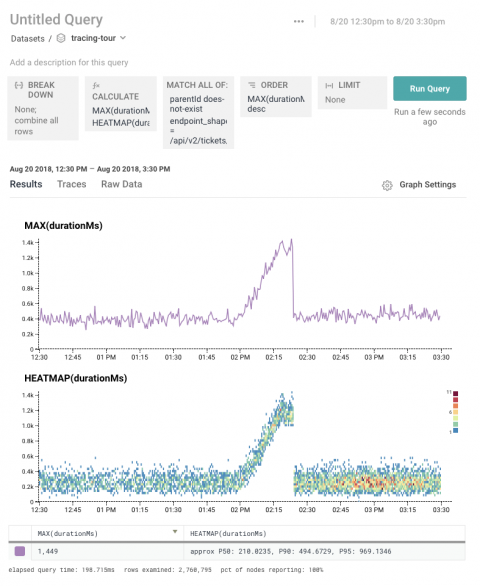
Here at the Hive, we know that there’s nothing like getting your hands on something to see what using it to solve a problem is really like. In July, we launched the Gatekeeper tour, which walks you through the process of solving a real outage we experienced, using Honeycomb. That’s why we’re excited to launch a new place for you to play: the Tracing Tour at http://play.honeycomb.io.

Node.js monitoring with Datadog APM and distributed tracing

Node.js is an asynchronous JavaScript runtime that is used to develop highly scalable network applications. To help provide more visibility into these dynamic environments, we’re pleased to announce that Datadog APM has officially released support for monitoring Node.js applications, which joins our existing support for Java, Ruby, Python and Go.

Introducing APM Trace Search & Analytics with infinite cardinality

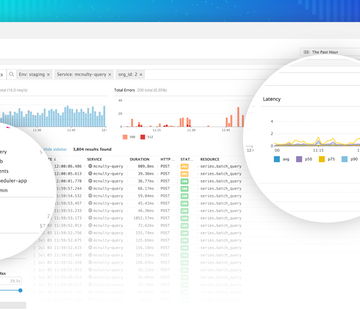
Distributed tracing provides a detailed view into application performance. Each trace shows you how an individual request was executed in your app: which user did what, which services were involved, how long it took, and whether the request executed successfully. Capturing that level of detail across hundreds or thousands of services provides a vast trove of information for troubleshooting and performance optimization, but it’s not always easy to find the exact trace events you need.

Zipkin vs Jaeger: Getting Started With Tracing

Request tracing is the ultimate insight tool. Request tracing tracks operations inside and across different systems. Practically speaking, this allows engineers to see the how long an operation took in a web server, database, application code, or entirely different systems, all presented along a timeline. Request tracing is especially valuable in distributed systems where a single transaction (such as “create an account”) spans multiple systems.

There And Back Again: A Honeycomb Tracing Story

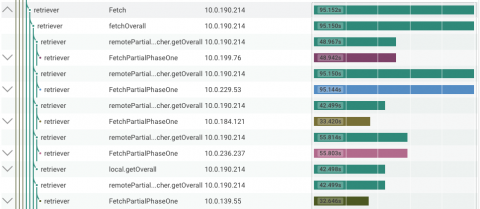
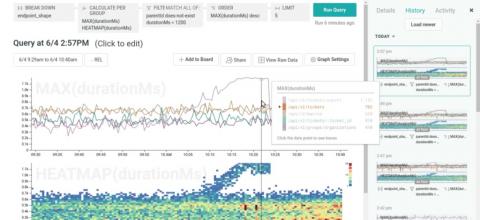
In our previous post about Honeycomb Tracing, we used tracing to better understand Honeycomb’s own query path. When doing this kind of investigation, you typically have to go back and forth, zooming out and back in again, between your analytics tool and your tracing tool, often losing context in the process.

Jaeger vs Zipkin - OpenTracing Distributed Tracers

In the previous three parts of our OpenTracing series, we provided an Overview of OpenTracing, explaining what OpenTracing is and does, how it works and what it aims to achieve, we looked at Zipkin – a popular open-source distributed tracer and then at Jaeger – a newer open-source distributed tracer developed under the CNCF umbrella. In this blog post – the last part of the OpenTracing series – we will compare Jaeger vs. Zipkin side by side!

Distributed Tracing with Zipkin and ELK

While logs can tell us whether a specific request failed to execute or not and metrics can help us monitor how many times this request failed and how long the failed request took, traces help us debug the reason why the request failed, or took so long to execute by breaking up the execution flow and dissecting it into smaller events.

OpenTracing: Jaeger as Distributed Tracer

In the previous two parts of OpenTracing series, we provided a good OpenTracing overview, explaining what OpenTracing is and does, how it works and what it aims to achieve and looked at Zipkin – a popular open-source distributed tracer. In this blog post, we will look at Jaeger, a newer open-source distributed tracer developed under the CNCF umbrella.