Operations | Monitoring | ITSM | DevOps | Cloud

Latest News

Combining AIOps Methods with New Approaches to Distributed Tracing

Humans are naturally visual creatures. Several of us are visual learners, meaning, we learn by seeing things in action. Tracing is seeing things in action. Troubleshooting where and why something is slow or flat out broken, with clear visual indication, is incredibly powerful.

Tracing Tools Compared: Jaeger vs. OpenTracing

With the advent of microservices, technologies like Docker, Kubernetes and services like Cloud Computing, have showcased the broader need for observability. Collecting valuable information about the communication endpoints and how they propagate through the discrete components of the application stack is the key to understanding when, why and what happens in case of failure.

Jaeger Essentials: Performance Blitz with Jaeger

I’d like to share some of the best practices we’ve learned on our journey to battle performance issues with the Jaeger tracing tool. Some may say we are experts in logging. We log for a living, and have our log analytics service (which we based on open source ELK Stack) to prove it. We’ve mastered logging to the level where debugging and troubleshooting our system is a no-brainer.

Jaeger clients and W3C Trace-Context

In this article, we are going to have a look at using Jaeger clients with W3C Trace-Context propagation format. The standardized context propagation format assures interoperability between different tracing systems and instrumentation libraries. In this regard we are going to explore two use cases. First how to use OpenTelemetry SDKs in Jaeger instrumented environment.

New in Grafana 7.0: Trace viewer and integrations with Jaeger and Zipkin

Moving to a scalable, distributed microservice architecture poses a great deal of challenges for any organization. It gets harder to understand the system and pinpoint where errors originate. Logs get much messier, and stitching together a coherent picture of a particular request can be time-consuming or downright impossible. Distributed tracing can help with all of that.

Exploring Jaeger traces with Elastic APM

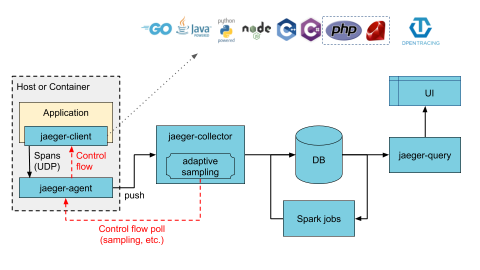
Jaeger is a popular distributed tracing project hosted by the Cloud Native Computing Foundation (CNCF). In the Elastic APM 7.6.0 release we added support for ingesting Jaeger traces directly into the Elastic Stack. Elasticsearch has long been a primary storage backend for Jaeger. Due to its fast search capabilities and horizontal scalability, Elasticsearch makes an excellent choice for storing and searching trace data, along with other observability data such as logs, metrics, and uptime data.

Adopting Distributed Tracing: Finding the Right Path

Here at Sumo Logic, we share a lot of thoughts about managing data at scale, and the innovative ways we help customers address their unique use cases. It’s not just about analysis of logs. In this article, I will talk about another important observability signal: distributed traces. I will share a few observations about how we at Sumo think about the future of adoption of distributed traces, a very important concept, taking from our own experience.

Feature Spotlight: Auto-Tracing

Lumigo’s Auto-Tracing allows you to implement distributed tracing on your Lambda functions with 3-clicks and no manual code changes. If you’ve already decided to move to a serverless infrastructure, you probably understand the importance of monitoring your AWS Lambdas and what it might entail. For the few out there that are still wondering what monitoring AWS Lambda means, I’ll break it down for you in a couple of steps.