Operations | Monitoring | ITSM | DevOps | Cloud

Latest News

ScaleUP 2020 Recap: Introducing Distributed Tracing & More

Today was a monumental day for Logz.io and our entire community. There is nothing more inspiring than seeing how people use the technology we’ve built to enhance their businesses. At ScaleUP 2020, our first ever global user conference, we hosted an exciting day of technical, customer-led sessions with our community. We also had the privilege of unveiling some ground-breaking new solutions and enhancements to our end-to-end cloud-native observability platform.

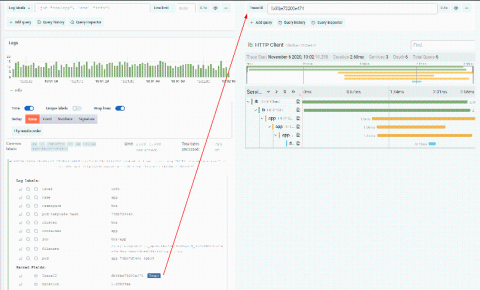
Trace discovery in Grafana Tempo using Prometheus exemplars, Loki 2.0 queries, and more

Grafana Tempo, the recently announced distributed tracing backend, relies on integrations with other data sources for trace discovery. Tempo’s job is to store massive numbers of traces, place them in object storage, and retrieve them by id. Logs and exemplars allow users to quickly and more powerfully jump directly to traces than ever before. Let’s dig into some examples with a live playground to try it out!

Introducing etrace - a multi-purpose application profiling tool

These days, the internal workings of Linux applications involve many different moving parts. Sometimes, it can be rather difficult to debug them when things go wrong or run slower than expected. Tracing an application’s execution is one way of understanding potential issues without diving into the source code. To this end, we wrote an app-tracing tool called etrace, designed to detect performance bottlenecks and runtime issues in snaps.

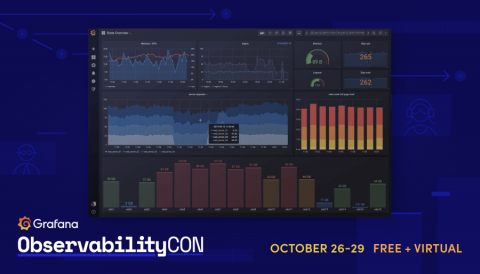
ObservabilityCON Day 3 recap: What's new in Loki 2.0, tracing made easy with Tempo, observability at the Financial Times, and a Minecraft NOC

Today is the last day of ObservabilityCON 2020! We hope you’ve had the chance to catch the talks so far, and will tune in live for today’s sessions. View the full schedule on the event page, and for additional information on viewing, participate in Q&As, and more, check out our quick guide to getting the most out of ObservabilityCON. If you aren’t up-to-date on the presentations so far, here’s a recap of day three of the conference.

Announcing Grafana Tempo, a massively scalable distributed tracing system

Grafana Labs is proud to announce an easy-to-operate, high-scale, and cost-effective distributed tracing system: Tempo. Tempo is designed to be a robust trace id lookup store whose only dependency is object storage (GCS/S3). Join us in the Grafana Slack #tempo channel or the tempo-users google group to get involved today!

AWS Distro for OpenTelemetry will send metrics and traces to Datadog

Datadog has a long-standing commitment to open standards. Our integrations with OpenMetrics, JMX, and WMI, as well as our implementation of the tried-and-true StatsD protocol, enable you to collect data with the tools and libraries that fit best into your workflows.

AWS Distro for OpenTelemetry, Grafana, Prometheus, Loki, OpenMetrics, and beyond: How Open Standards continue to shape modern observability

AWS is announcing the AWS Distro for OpenTelemetry today. This is a distribution of OpenTelemetry, itself a CNCF sandbox project. This is part of a wider push towards Open Source, cloud native technologies, and modern observability, all based on Open Standards. This push can be observed across the whole technology sector, but with increasing velocity from within AWS. As they are the largest public cloud provider by far, this is noteworthy in and of itself.

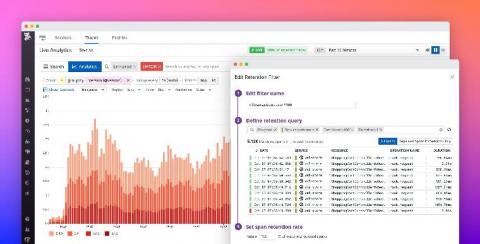
Tracing without Limits: live-query all traces, retain only the ones you need

Tracing is a critical part of monitoring application performance, especially as organizations shift to deploying services using distributed systems, serverless computing, and containerized environments. Teams need real-time, end-to-end visibility into all of the traces relevant to performance issues such as an application outage or an unresponsive service, but managing tracing costs often results in gaps in valuable tracing data.

Announcing Native OpenTelemetry Support in Splunk APM

At Splunk, we've been leading the way in observability and helping accelerate the adoption of the OpenTelemetry project. With the trace specification reaching a stable maturity level and several SignalFx Gateway and client library capabilities being upstreamed, we're ready to go all-in while we continue accelerating the growth and adoption of OpenTelemetry beyond the commitments we made last year.