Operations | Monitoring | ITSM | DevOps | Cloud

Latest News

Interview with Honeycomb Engineer Chris Toshok: Dogfooding OpenTelemetry

At Honeycomb, we talk a lot about eating our own dogfood. Since we use Honeycomb to observe Honeycomb, we have many opportunities to try out UX changes ourselves before rolling them out to all of our users. UX doesn’t stop at the UI though! Developer experience matters too, especially when getting started with observability. We often get questions about the difference between using our Beeline SDKs compared with other integrations, especially OpenTelemetry (abbreviated “OTel”).

Jaeger Turns Five: A Tribute to Project Contributors

August 3rd, 2015 was the date of the first commit in the internal Jaeger repository at Uber. Technically, the true birthday of the project was probably a week or so earlier, because while I was prototyping the collector service we went through a number of project names, some of them rather embarrassing to name here, and the real first commits happened in a differently named repository.

Introducing the Sumo Logic Observability suite with distributed tracing (beta) - a cornerstone of cloud-native APM

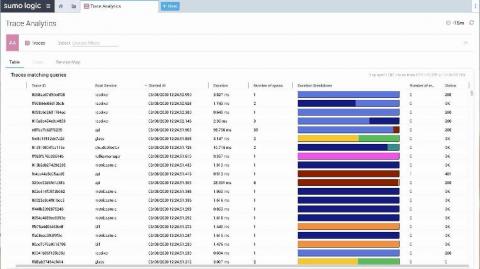
Last week Sumo Logic announced our new Observability Suite, which included the public introduction of the closed beta for our distributed tracing capabilities as part of our Microservices Observability solution. This new solution will provide end-to-end visibility into user transactions across services, as well as seamless integration into performance metrics and logs to accelerate issue resolution and root-cause analysis. In this blog, we’ll explore the new solution in detail.

Jaeger Essentials: Best Practices for Deploying Jaeger on Kubernetes in Production

Logs, metrics and traces are the three pillars of the Observability world. The distributed tracing world, in particular, has seen a lot of innovation in recent months, with OpenTelemetry standardization and with Jaeger open source project graduating from the CNCF incubation. According to the recent DevOps Pulse report, Jaeger is used by over 30% of those practicing distributed tracing.

Where did all my spans go? A guide to diagnosing dropped spans in Jaeger

Nothing is more frustrating than feeling like you’ve finally found the perfect trace only to see that you’re missing critical spans. In fact, a common question for new users and operators of Jaeger, the popular distributed tracing system, is: “Where did all my spans go?” In this post we’ll discuss how to diagnose and correct lost spans in each element of the Jaeger ingestion pipeline.

How to maximize span ingestion while limiting writes per second to Scylla with Jaeger

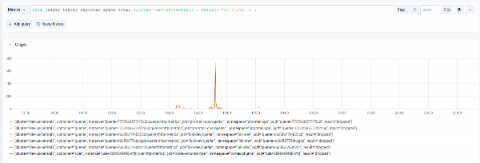
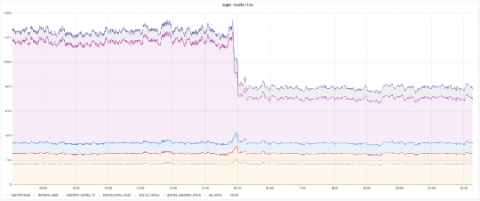
Jaeger primarily supports two backends: Cassandra and Elasticsearch. Here at Grafana Labs we use Scylla, an open source Cassandra-compatible backend. In this post we’ll look at how we run Scylla at scale and share some techniques to reduce load while ingesting even more spans. We’ll also share some internal metrics about Jaeger load and Scylla backend performance. Special thanks to the Scylla team for spending some time with us to talk about performance and configuration!

Instrument your Python applications with Datadog and OpenTelemetry

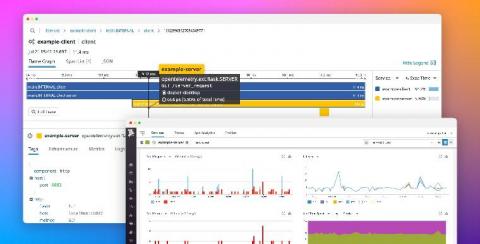
If you are familiar with OpenTracing and OpenCensus, then you have probably already heard of the OpenTelemetry project. OpenTelemetry merges the OpenTracing and OpenCensus projects to provide a standard collection of APIs, libraries, and other tools to capture distributed request traces and metrics from applications and easily export them to third-party monitoring platforms.

How to maximize span ingestion while limiting writes per second to a Scylla backend with Jaeger tracing

Jaeger primarily supports two backends: Cassandra and Elasticsearch. Here at Grafana Labs we use Scylla, an open source Cassandra-compatible backend. In this post we’ll look at how we run Scylla at scale and share some techniques to reduce load while ingesting even more spans. We’ll also share some internal metrics about Jaeger load and Scylla backend performance. Special thanks to the Scylla team for spending some time with us to talk about performance and configuration!

Distributed tracing analysis backend that fits your needs

I am spending a considerable amount of time recently on distributed tracing topics. In my previous blog, I discussed different pros and cons of various approaches to collecting distributed tracing data. Right now I would like to draw your attention to the analysis back-end: what does it take to be good at analyzing transaction traces?