Operations | Monitoring | ITSM | DevOps | Cloud

Latest News

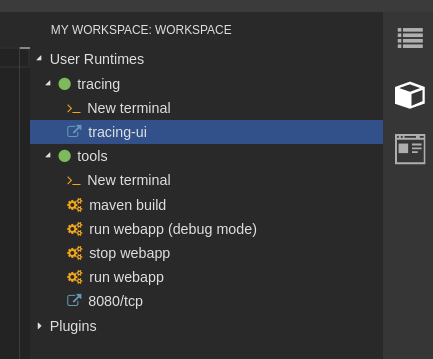
Using Jaeger with Eclipse Che

As explained on the Eclipse Che website, “Che brings your Kubernetes application into your development environment and provides an in-browser IDE, allowing you to code, build, test and run applications exactly as they run on production from any machine”. However when deployed in your production environment, those same applications can be monitored using observability tools to understand their performance to help inform future improvements.

Takeaways from PagerDuty Summit: Tracing + Timely Alerts

Last week, we spoke with a lot of folks at PagerDuty Summit, where we explored the power of error monitoring in a world that’s always on (or on-call). What a neat tweet. Throughout our conversations, one thing became clear: developers are seeking out increased efficiency — they want to minimize time to error detection and resolution. They want to know about issues, find the root cause, and fix them quickly so that they can move on to other things — like writing more code.

Weaveworks Combines Jaeger Tracing With Logs and Metrics for a Troubleshooting Swiss Army Knife

Founded in 2014, Weaveworks Inc. makes software that helps developers and DevOps teams build, run and manage containerized applications on Kubernetes. Its products include GitOps-based cluster management, and application delivery, observability and monitoring solutions for services running on Kubernetes. It is a founding member of the Cloud Native Computing Foundation.

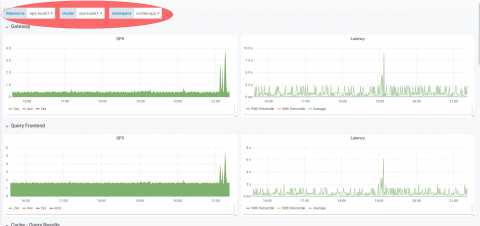
How Grafana Labs Is Running Jaeger at Scale with Prometheus and Envoy

At Grafana Labs, we are always working on optimizing query time on our Grafana Cloud hosted metrics platform, which incorporates our Metrictank Graphite-compatible metrics service, and Cortex, the open source project for multitenant, horizontally scalable Prometheus-as-a-Service.

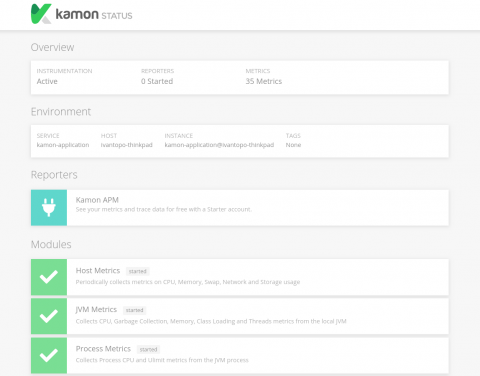
Kamon Just Got a Lot Easier to Use, Welcome Kamon 2.0!

Dear community, Kamon 2.0 is out and ready to roll! For this release we focused primarily on simplifying the installation proces and making sure that the core APIs are more solid and user friendly, since they will be the foundations upon which we will instrument the whole JVM world in the months to come!

Using Elasticsearch Rollover to manage indices

In this article you will learn how to configure and use the Elasticsearch rollover feature in Jaeger. Note that this feature has been introduced in Jaeger 1.10.0. Jaeger uses index-per-day pattern to store its data to Elasticsearch. It creates a new index for each day based on span’s timestamp. These indices have to be periodically removed by jaeger-es-index-cleaner cron job. Typically users keep data from one week up to one month which results in 7 or 30 indices only for spans.

Getting started with Jaeger to build an Istio service mesh

Service mesh provides a dedicated network for service-to-service communication in a transparent way. Istio aims to help developers and operators address service mesh features such as dynamic service discovery, mutual transport layer security (TLS), circuit breakers, rate limiting, and tracing. Jaeger with Istio augments monitoring and tracing of cloud-native apps on a distributed networking system.

Grafana Labs Teams Use Jaeger to Improve Query Performance Up to 10x

Grafana Labs works everyday to break traditional data boundaries with metric-visualization tools accessible across entire organizations. It began as a pure open-source project and has since expanded into supported subscription services. The Grafana open-source project is a platform for monitoring and analyzing time series data. There are also subscription offerings such as the supported Grafana Enterprise version. Grafana Labs’ engineers service more than 150,000 active installations.

Distributed Tracing with Jaeger and the ELK Stack

Over the past few years, and coupled with the growing adoption of microservices, distributed tracing has emerged as one of the most commonly used monitoring and troubleshooting methodologies. New tracing tools and frameworks are increasingly being introduced, driving adoption even further. One of these tools is Jaeger, a popular open source tracing tool. This article explores the integration of Jaeger with the ELK Stack for analysis and visualization of traces.