Operations | Monitoring | ITSM | DevOps | Cloud

Latest News

Website Monitoring: Best Practices

In theory, the default monitoring check settings should work in the majority of cases. However, everyday practice shows that our case does not belong to this majority. Therefore, it is necessary and worthwhile to dedicate some time to the optimal configuration of monitoring. It is also important to properly prepare the monitored website and the organization itself.

Optimizing logs for a more effective CI/CD pipeline [Best Practices]

Continuous Integration and Continuous Delivery (CI/CD) delivers services fast, effectively, and accurately. In doing so, CI/CD pipelines have become the mainstay of effective DevOps. But this process needs accurate, timely, contextual data if it’s to operate effectively. This critical data comes in the form of logs and this article will guide you through optimizing logs for CI/CD.

The Ultimate Guide to Microservices Logging

Microservice architecture is widely popular. The ease of building and maintaining apps, scaling CI/CD pipelines, as well as the flexibility it offers when it comes to pivoting technologies are some of the main reasons companies like Uber and Netflix are all in on this approach. As the amount of services in a microservice architecture rises, complexity naturally also rises.

Troubleshooting Common Elasticsearch Problems

Elasticsearch is a complex piece of software by itself, but complexity is further increased when you spin up multiple instances to form a cluster. This complexity comes with the risk of things going wrong. In this lesson, we’re going to explore some common Elasticsearch problems that you’re likely to encounter on your Elasticsearch journey.

How Capgemini Solved Multi-Cloud Observability on Heroku/Salesforce

The modern enterprise has expanded its reach by using the power of cloud computing. However, with that power comes complexity in leveraging the multiple platforms needed to provide rich functionality. To achieve a seamless integration that involves multiple cloud infrastructures you need insightful and actionable data. You also need the right team to bring the clouds together in a seamless, effective, and efficient manner.

How Raygun increased transactions per second by 44% by removing Nginx

Here at Raygun, improving performance is baked into our culture. In a previous blog post, we showed how we achieved a 12% performance lift by migrating Raygun’s API to .NET Core 3.1. In publishing this, a question was asked on Twitter as to why we still use Nginx as a proxy to the Raygun API application. Our response was that we thought this was the recommended approach from Microsoft. It turns out this has not been the case since the release of .NET Core 2.1.

Zero instrumentation serverless observability with AWS SAM and CDK integrations

As organizations build out their serverless footprint, they might find themselves managing hundreds or thousands of individual components (e.g., Amazon S3 buckets, Amazon DynamoDB tables, AWS SQS queues) for just a single application. At the same time, performance issues can crop up at any of these points, which means that having access to detailed observability data from your serverless functions is crucial for effective troubleshooting.

Sponsored Post

Meet the new nodes!

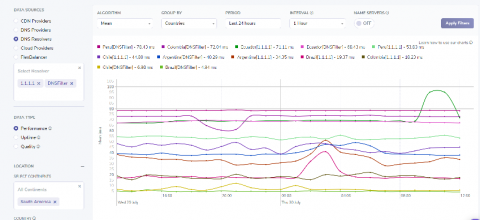
One of the most important sources of PerfOps data is synthetic benchmarking. Authoritative DNS providers, public DNS resolvers and Cloud providers are tested every minute from more than 250 locations around the world. The data is collected and processed round the clock, for several years now. And that is obvious, the more test servers in different locations we have - the more accurate and valuable our results are.