Operations | Monitoring | ITSM | DevOps | Cloud

Latest News

Community Highlight: How InfluxDB Enables IoT Monitoring of Gas Station Tanks

I recently spoke with Alex Skrivseth, the Operations Manager at The Shed App, and discovered how he’s using InfluxDB to monitor the current levels of gas and diesel at various gas stations. Simply by extracting IoT sensor data, he has been able to provide valuable previously inaccessible data to fuel truck drivers.

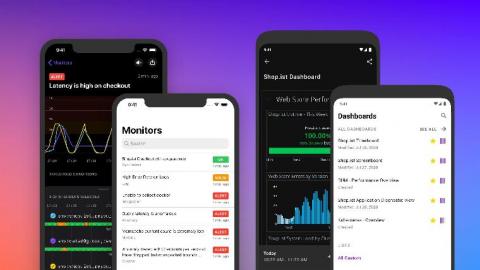
Introducing the Datadog mobile app

When you’re on call and get paged at an inconvenient time, you need to be able to quickly determine the seriousness of the issue and act decisively to reduce system downtime. But pager notifications often don’t give you the information you need to investigate an issue from your mobile device, meaning that access to a laptop at all times is a must.

Stream logs to Datadog with Amazon Kinesis Data Firehose

Amazon Kinesis Data Firehose is a service for ingesting, processing, and loading data from large, distributed sources such as clickstreams into multiple consumers for storage and real-time analytics. AWS recently launched a new Kinesis feature that allows users to ingest AWS service logs from CloudWatch and stream them directly to a third-party service for further analysis.

Debug JavaScript in Microsoft Edge in 7 steps

This article will focus on debugging JavaScript code within Microsoft Edge Developer Tools. The Edge DevTools are a powerful toolset built into the Edge browser on Microsoft Windows 10. The DevTools are also available as a standalone app to download from the Microsoft Store, if one prefers to run them separately from Edge itself. We’ll be using Raygun Crash Reporting to find the stack trace and the line of code the error occurred on. You can sign up for a free 14-day trial here.

AppSignal Now Supports Redis for Node.js Out of the Box

Starting today with version 0.6.0 of the Node.js integration, instrumenting a Node.js app that uses Redis is much easier. In fact, we instrument it for you - meaning that if you use Redis in your own app, there’s no extra work for you, everything Just Works™ out of the box! 🎉

Codeless Workflow Automation: Understanding The What, Why and How.

Over the last few decades, some firms have worked hard to hire the right people and develop the right processes. However, those achievements have not translated into bottom-line growth. A more detailed examination of that matter shows that the issue lies somewhere in productivity.

Site24x7 Server Monitoring: Your pit stop for capturing the disk monitoring flag

All storage devices, whether on-premises or in the cloud, are used to store or maintain data in a server. To organize files based on usage and perform read/write operations, the disk is divided into separate portions called partitions. A partition can contain the entire disk space or some of it. Disk usage gives the amount of space used by the storage device to read/write an operation.

How to Stay on Google's Good Side

For the first 6 months of 2020, Google has continued its monopoly on search engine use with an average net market share of 69.24%. Google’s continued favoritism puts it in a position to funnel the bulk of interested organic web traffic to your business making its blacklist a costly place to be. So, how do you stay on this giant’s good side?

The Complete Guide to Metrics, Monitoring & Alerting

Monitoring your system and infrastructure is critical to ensure the performance of your services. In fact, as software development moves faster and faster, alerting and monitoring becomes an indispensable practice for modern DevOps teams. Why is that exactly? That’s what I’m going to discuss today.

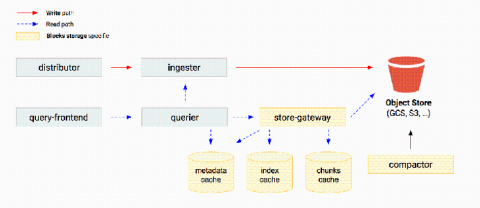
How blocks storage in Cortex reduces operational complexity for running Prometheus at massive scale

Cortex is a long-term distributed storage for Prometheus. It provides horizontal scalability, high availability, multi-tenancy and blazing fast query performances when querying high cardinality series or large time ranges. Today, there are massive Cortex clusters storing tens to hundreds of millions of active series with a 99.5 percentile query latency below 2.5s.