Operations | Monitoring | ITSM | DevOps | Cloud

Latest News

Advanced Network Monitoring with Pandora FMS

Pandora FMS has become well known as a reliable, flexible advanced network monitoring solution. It allows businesses of all sizes to monitor and manage network and hardware issues in real time, and integrates all of the monitored terminals, servers, and other entities into a centralized system. These features mean that Pandora FMS has become the go-to choice for small businesses looking to deploy advanced network monitoring technologies for the first time.

Kubernetes observability tutorial: Monitoring application performance with Elastic APM

This post is the third in our Kubernetes observability tutorial series, where we explore how you can monitor all aspects of your applications running in Kubernetes, including: We’ll discuss using Elastic Observability to perform application performance monitoring (APM) with the Elastic APM.

Server Monitoring and Alerts - Getting Past Common Obstacles

Keeping a server running optimally on a consistent basis involves managing multiple system elements simultaneously. Automated scripts and specialized software can handle the tasks your server needs to complete on a daily basis—but when one of these experiences an error, it can throw the entire system off.

The case for boring tech

Solutions for challenging technical problems shouldn’t result in a whole set of new ones. Sometimes, we make things harder on ourselves by choosing the new hotness to tackle technical problems (such as scaling infrastructure). We may be solving our problem in an interesting and fun way, but we bring on more complexity (and more problems) as a result of that technology choice.

How to protect your IT infrastructure from a Maze ransomware attack

Pitney Bowes, a global package delivery giant, has been hit by a second ransomware attack in less than seven months, according to ZDNet. Those responsible for the attack have released screenshots portraying directory listings from inside the company’s network. What is Maze ransomware and what makes it so special?

Optimizing Your Alerting Escalation Policy

Reacting to alerts can be a pain, however, there are ways to be proactive and decrease frustration concerning IT Alerting. Developing an alerting strategy saves IT Operations and Development teams time, money, and eliminates notifications from low priority alerts. Keep reading for more information on routing and escalation chains, fielding alerts, and how to communicate an alerting strategy to management.

Monitoring AWS Lambda with Prometheus and Sysdig

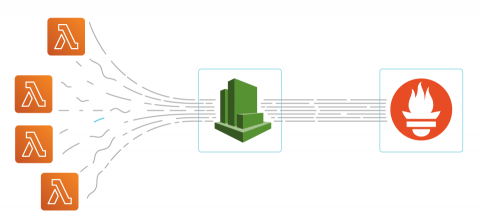
In this post, we will show how it’s easily possible to monitor AWS Lambda with Sysdig Monitor. By leveraging existing Prometheus ingestion with Sysdig, you will be able to monitor serverless services with a single-pane-of-glass approach, giving you the confidence to run these services in production.

Prometheus Metric Federation with Thanos

Prometheus is a CNCF graduated project for monitoring and alerting. It is one of the most widely used monitoring and alerting tools in the Kubernetes ecosystem. Rancher users can leverage Prometheus quickly by using the built-in monitoring stack. Prometheus stores its metrics as a time series database on the local disk. Prometheus local storage is limited by the size of the disk and amount of metrics it can retain.

Why Netdata picked VerneMQ

In 2019, the Netdata team already knew that a Netdata Cloud solution in the form of an online platform would greatly complement Netdata’s distributed monitoring by making it much easier to organize large infrastructures and by enabling new ways for teams to collaborate. The old node registry available at the time wasn’t enough for Netdata’s users. Building an online platform, even one that does not directly process users’ metrics, is challenging.